
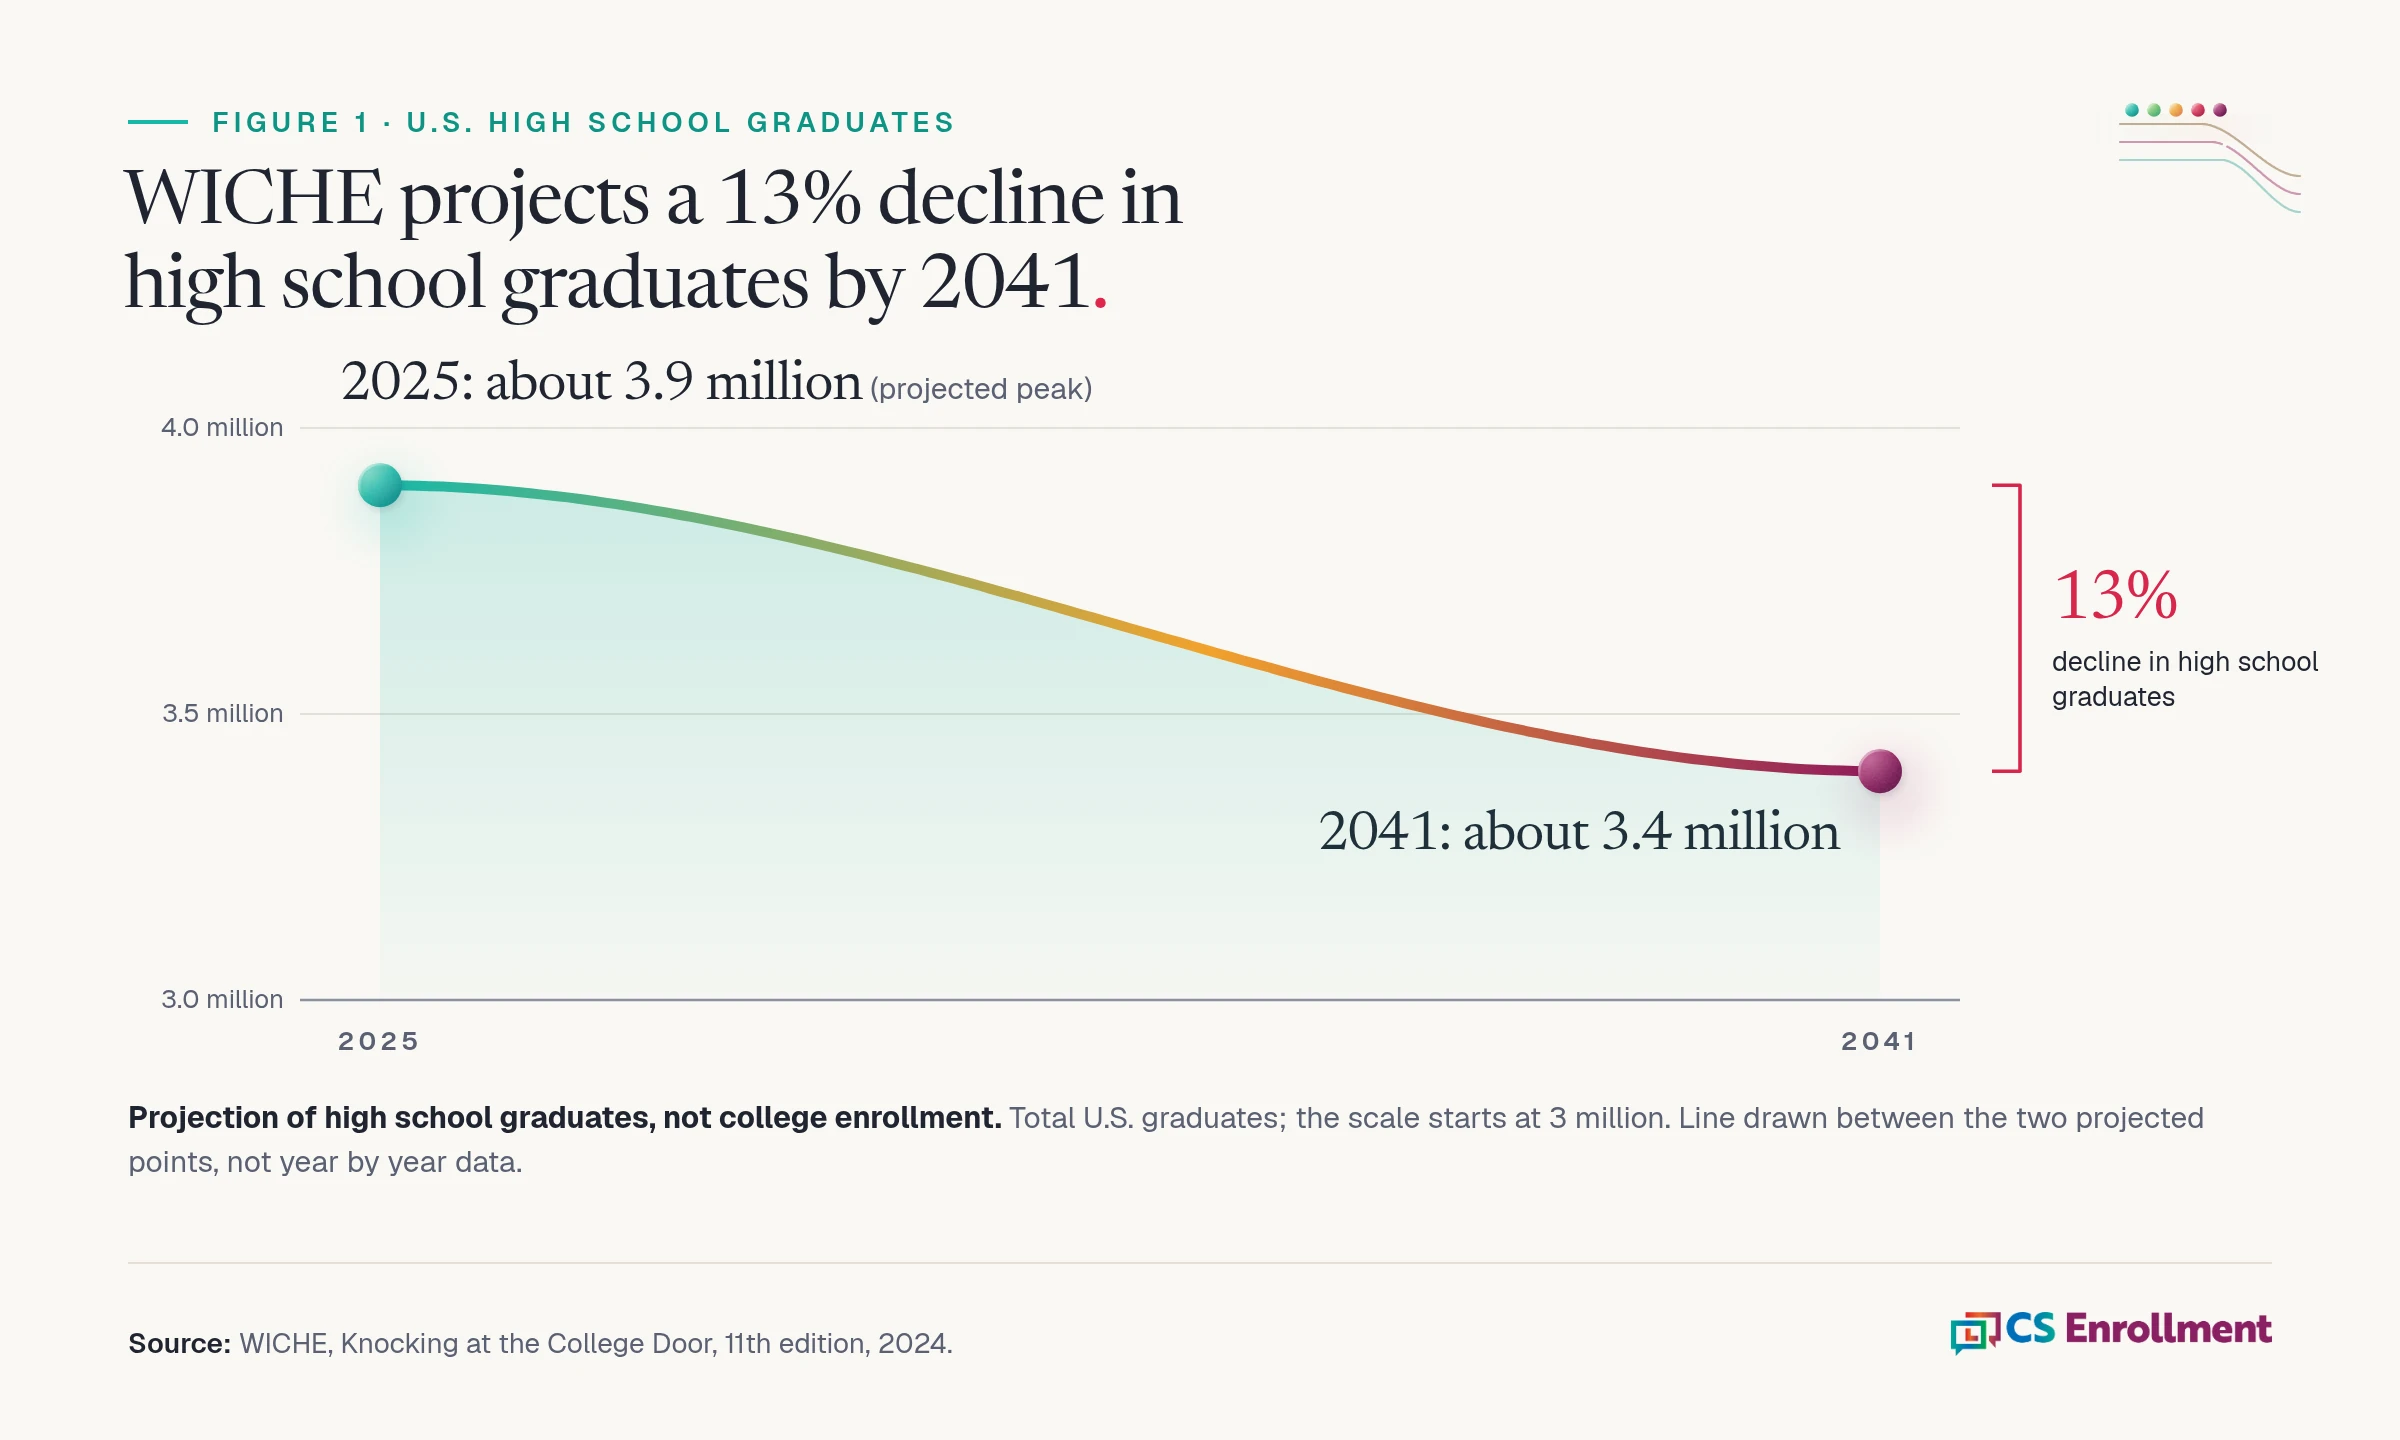
The short answer: WICHE projects that the number of U.S. high school graduates peaked in 2025 at about 3.9 million, and it projects a 13% decline in high school graduates to about 3.4 million by 2041, with the steepest drops in the West, Northeast and Midwest. For a small college the cliff is regional and gradual, so the response is a recruiting and conversion plan, not panic.
What is the demographic cliff?
The demographic cliff is a projected decline in the number of high school graduates. Births fell sharply during the Great Recession, so about 18 years later there are fewer 18 year olds. The Western Interstate Commission for Higher Education (WICHE) projects that graduates peak in 2025 and then decline steadily through 2041.
It is a projection of high school graduates, not of college enrollment. A 13% drop in graduates does not mean a 13% drop in college students. Higher Ed Dive reports that WICHE's latest projections describe "a more gradual drop over the next 15 years than the cliff metaphor suggests."
WICHE's projections have a solid record. According to WICHE, earlier editions' projections of public high school graduates came within about 3% of the actual numbers, on average, reported for years within the first five years of each projection.
Has the demographic cliff already started?
By WICHE's projection, 2025 was the peak year, so the decline has begun. There is no national fall 2026 enrollment count yet.
State preliminary counts show how unevenly it lands. In Michigan, enrollment at the 15 public universities fell 2.01% in fall 2026, from 259,330 to 254,107, according to the Michigan Association of State Universities (MASU). The smallest, Lake Superior State, fell 14.44%. MASU's chief executive, Dan Hurley, pointed to "the continued demographic challenge of a declining number of high school graduates," as quoted by Bridge Michigan.
Massachusetts went the other way. State university enrollment grew 2.2%, or 699 students, to 32,345, and new transfers rose 16.6%, or 411 students. Institutions credited "an influx of transfer students from community colleges and recently closed independent institutions." In the same year, some colleges gained because others closed.
Which states and regions are hit hardest?
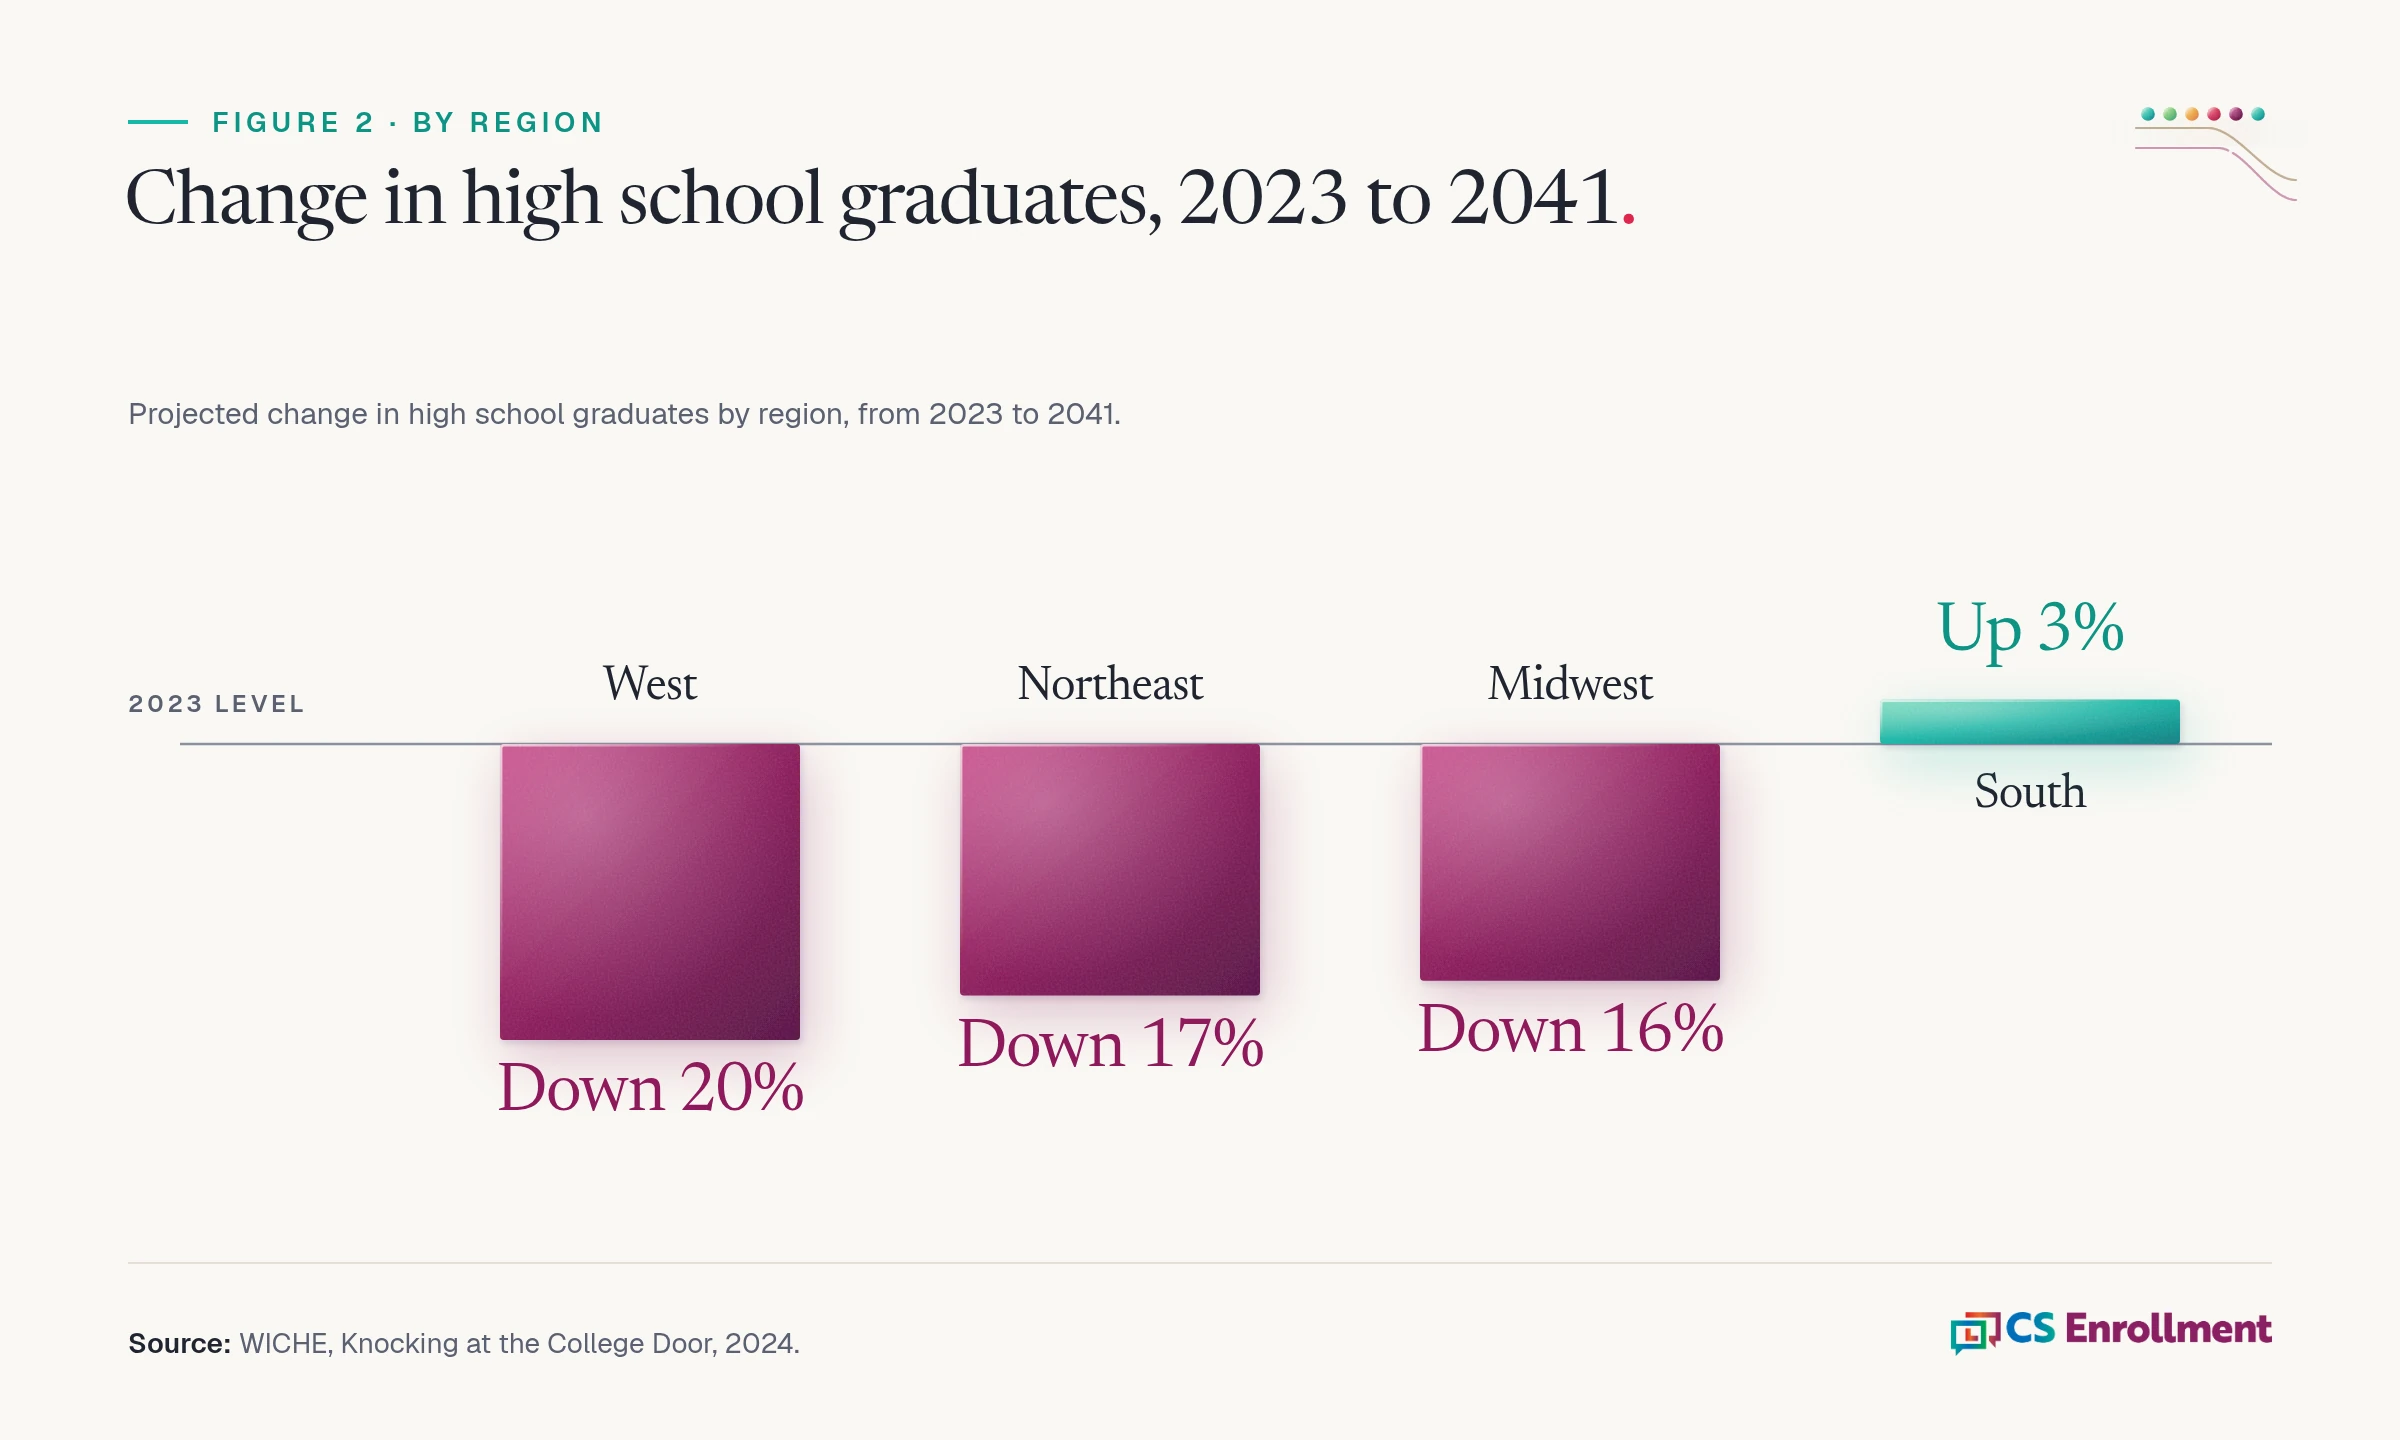
WICHE projects these changes in high school graduates between 2023 and 2041: the West down 20%, the Northeast down 17%, the Midwest down 16% and the South up 3%. Compared with 2023, 38 states are projected to see fewer graduates by 2041, and only 10 states are projected to grow from the 2025 peak.
Five large states account for three quarters of the national decline: California (down 29%), Illinois (down 32%), Michigan (down 20%), New York (down 27%) and Pennsylvania (down 17%).
To check your state, pull its profile from WICHE's data visualizations.
Who will the students of 2030 and 2040 be?
The graduating class is changing as it shrinks. WICHE projects Hispanic public high school graduates growing to about 36% of the public graduating class in 2041. Multiracial public graduates grow from about 127,000 in 2023 to 214,000 by 2041. White public high school graduates decline 26%, from 1.63 million to 1.2 million. These figures cover public schools only.
For an enrollment office, the point is to know who is in your own pipeline and speak to those students and their families. Families have channel preferences colleges underuse. In the 2025 Prospective Family Engagement Report from RNL, Ardeo and CampusESP, 30% of families preferred text messages while 21% of institutions used them, and text preference rose to 36% among first generation families. That is vendor research.
Does fewer graduates mean fewer college students?
Not automatically. The U.S. Bureau of Labor Statistics reports that in October 2024, 62.8% of 2024 high school graduates ages 16 to 24 were enrolled in college. WICHE notes that students under 25 still make up about two thirds of incoming college students, so the high school pipeline remains the main source. In a purely hypothetical exercise, WICHE calculated that if the share of high school graduates going straight to college rose by 0.5% per year from 62%, immediate college enrollment would "actually increase slightly for 2041 graduates compared to 2024." WICHE itself calls the scenario "perhaps overly optimistic."
Competition for each student is also rising. The Common App reports 7.06 applications per first year applicant in 2025 to 2026, up from 6.79 the year before.
What should a small college enrollment office do first?
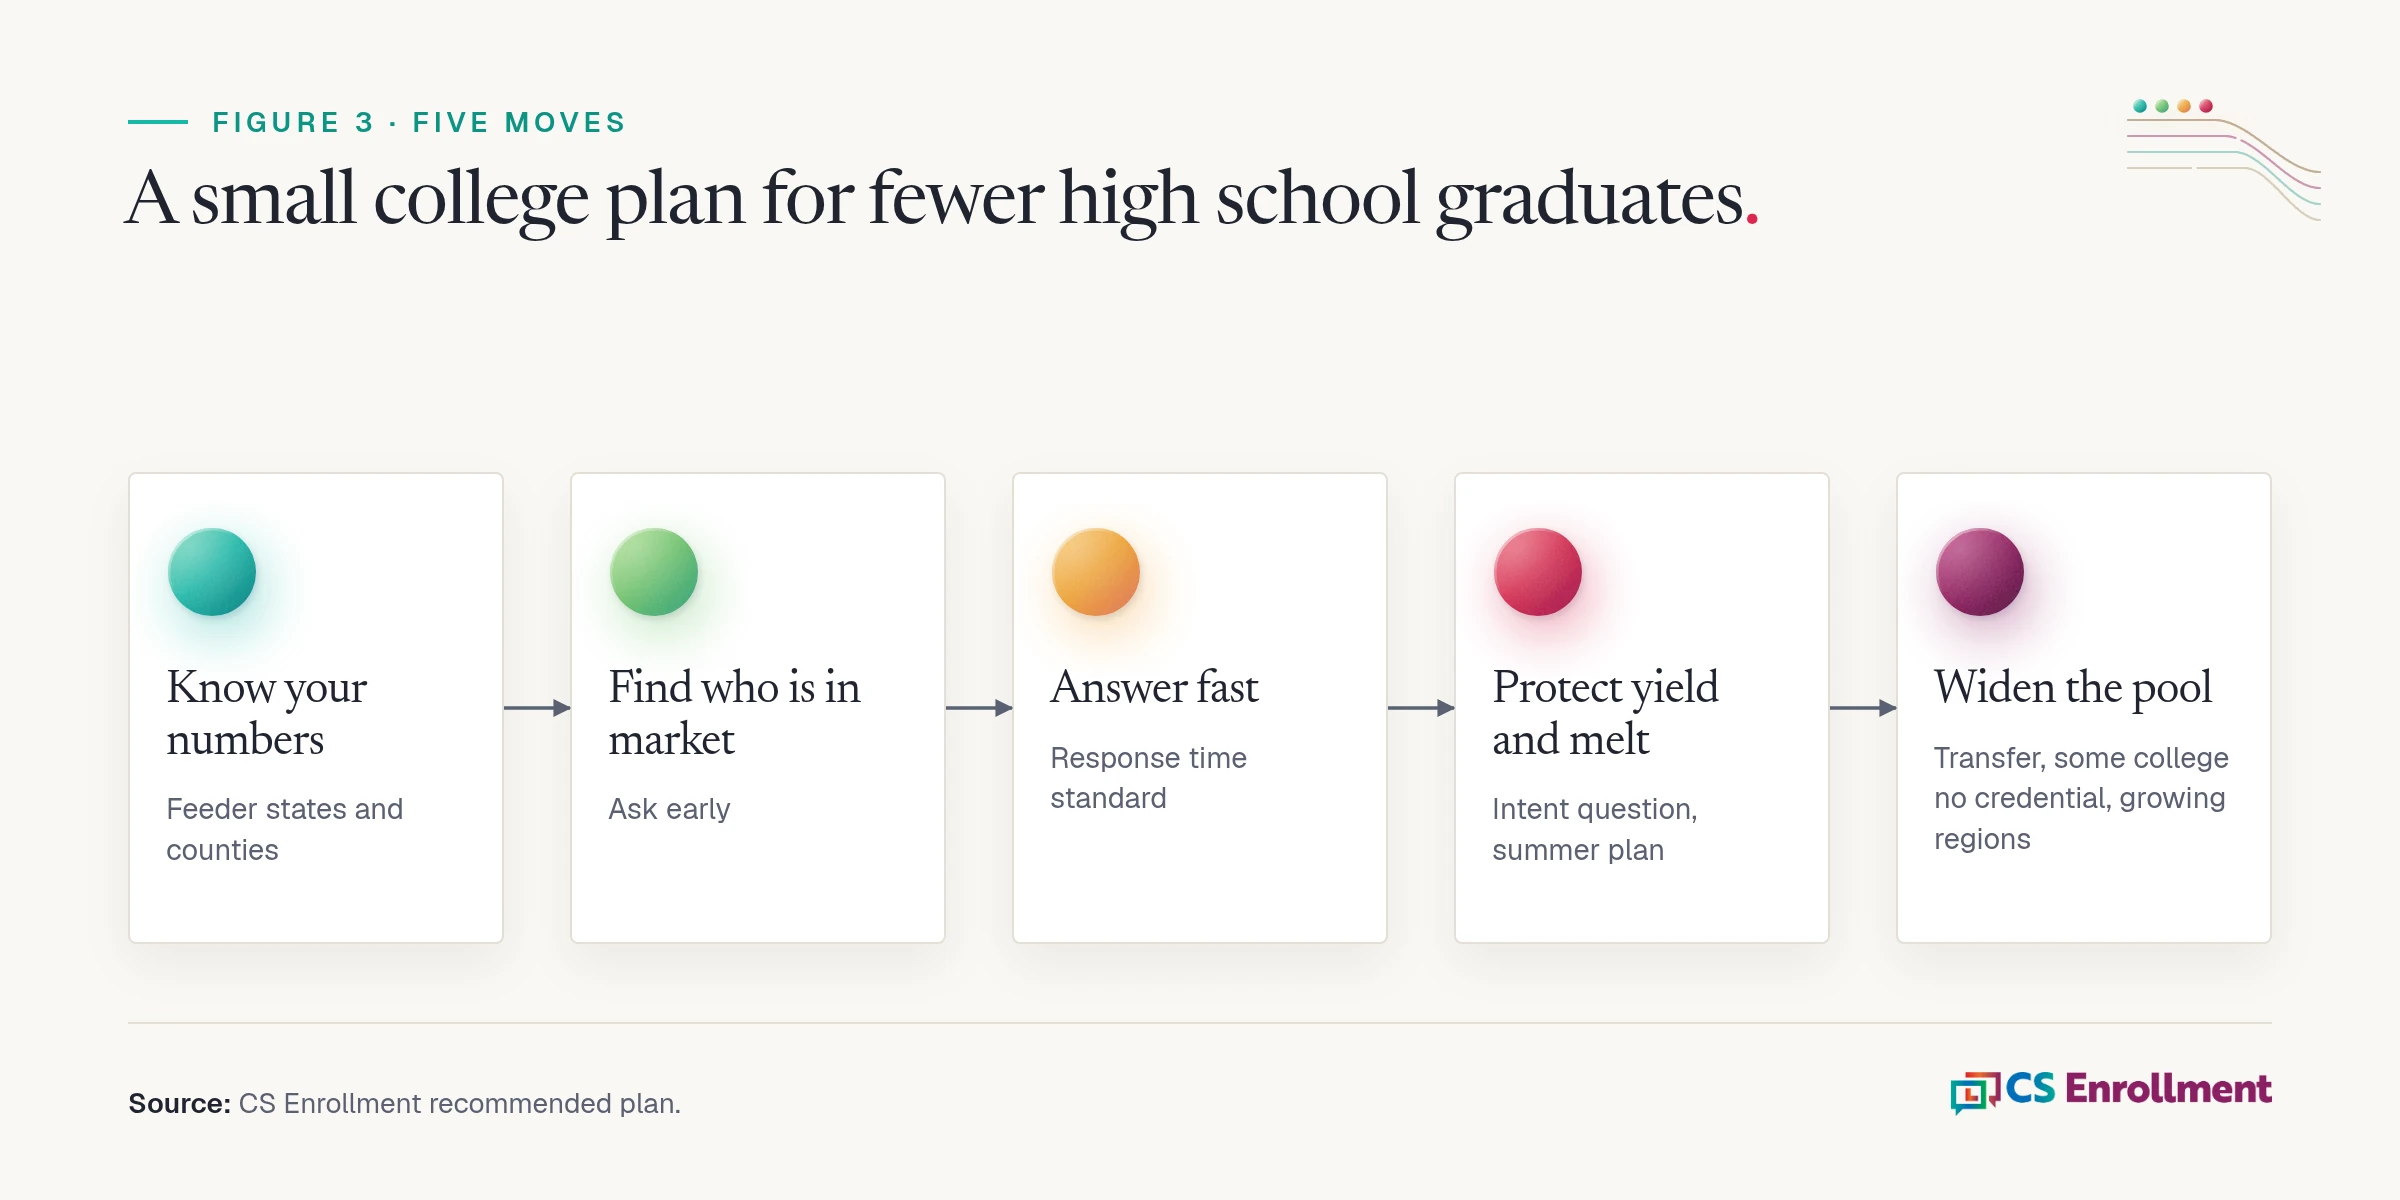
Fewer students means each inquiry and each admit is worth more. Five moves, each with one concrete step:
1. Know your numbers. Pull WICHE's profiles for your top feeder states. Then chart your own inquiries, admits and yield by county for the last five years. 2. Find the students who are actually in market, early. Ask, do not just mail. Our post on survey led student search explains why a question draws more replies. CS Enrollment Pathways starts with a short survey sent as a branded, verified message, so a small office learns which prospects and admits are ready and what is holding them back while there is still time to act. With fewer students to go around, knowing who is ready matters more than reaching more names. 3. Answer fast and personally. Set a response time standard for every inquiry and track it weekly. Make sure students can find accurate answers about you; see how students find colleges through AI answers. 4. Protect yield and melt. Ask admits whether they intend to deposit. In EAB research (2021), which is vendor research, about three quarters of students who answered "yes" enrolled and 1% of those who answered "no" did. Our posts on how to increase yield and how to reduce summer melt lay out the plans. 5. Widen the pool where you can serve it. Start with transfer students, as the Massachusetts numbers show. Add adults with some college and no credential: the National Student Clearinghouse Research Center counted 37.6 million working age people under 65 in that group as of the start of the 2023 to 2024 academic year. Then look at regions where graduates are growing.
Is adult and transfer recruiting the answer?
It is part of the answer, with a realism check. Speaking at an American Council on Education event, as reported by Higher Ed Dive, Lane said a college cannot become an adult serving institution overnight. In his words, "This is a yearslong process." Nathan Grawe warned against assuming a college can "recruit our way out of this mess" and against treating the shift "as if it's a light switch."
Start where the path is shortest: transfer students and stop out students who already have credits.
Should we just discount more?
No. NACUBO's preliminary average discount rate for first time, full time undergraduates at private nonprofits is 57.1%, as reported by Inside Higher Ed. In a Niche pulse survey, colleges under 2,000 students reported a median discount of 63%. In the same survey, 48% of colleges that relied on increased discounting hit deposit targets, against 67% of colleges that did not. That is vendor research and a correlation, not proof, but it suggests aid alone does not close the gap.
How do you measure whether your plan is working?
Track four rates against your own last three cycles: the share of your counties' graduates who inquire, inquiry to application, admit to deposit, and summer melt. Benchmark yourself, not a national average.
Frequently asked questions
What is the demographic cliff in higher education? It is the projected decline in U.S. high school graduates after a 2025 peak of about 3.9 million. WICHE projects a 13% decline in high school graduates to about 3.4 million by 2041.
When does the demographic cliff start? WICHE projects the peak year was 2025, followed by a steady decline in high school graduates through 2041.
Which states will have the biggest drop in high school graduates? WICHE projects the largest regional drops in the West (20%), Northeast (17%) and Midwest (16%). California, Illinois, Michigan, New York and Pennsylvania account for three quarters of the national decline.
Will college enrollment fall 13%? No. The 13% is WICHE's projection for high school graduates. Enrollment also depends on the college going rate, adult and transfer students and retention.
What can a small college do about the demographic cliff? Know your feeder counties, find students who are in market early, answer inquiries fast, protect yield and melt, and widen the pool with transfer and adult students you can serve.
Is recruiting adult learners enough to offset it? Not quickly. Speaking at an American Council on Education event, as reported by Higher Ed Dive, WICHE's Patrick Lane called becoming an adult serving institution "a yearslong process," so start with transfer and stop out students who already have credits.
To see how a short survey looks on a student's phone, request the sample walkthrough.
Sources
- Patrick Lane, Colleen Falkenstern and Peace Bransberger, Knocking at the College Door: Projections of High School Graduates, 11th edition.
- WICHE, Knocking at the College Door: Projections of High School Graduates, full report (PDF). 66 to 67.
- WICHE, Knocking at the College Door key findings: graduates. WICHE.
- WICHE, Knocking at the College Door press release.
- WICHE, Knocking at the College Door FAQs. WICHE.
- WICHE, Knocking at the College Door key findings: geography. WICHE.
- WICHE, Knocking at the College Door key findings: diversity. WICHE.
- WICHE, Knocking at the College Door key findings: implications. WICHE.
- WICHE, Knocking at the College Door data visualizations. WICHE.
- U.S. Bureau of Labor Statistics, College Enrollment and Work Activity of Recent High School and College Graduates.
- Michigan Association of State Universities, Preliminary Enrollment Report, Fall 2026.
- Bridge Michigan, University enrollment drops 2% in Michigan, first drop in three years.
- Massachusetts Department of Higher Education, Board of Higher Education enrollment trend deck, fall 2026 preliminary.
- Ben Unglesbee, You can't create 18 year olds: What can colleges do amid demographic upheaval?
- National Student Clearinghouse Research Center, Some College, No Credential.
- Common App, End of Season Report, 2025 to 2026: First Year Application Trends.
- Josh Moody, Tuition Discounting Continues to Climb.
- Johanna Alonso, 61 Percent of Colleges Have Met Their Enrollment Goals for Fall 2026.
- RNL, Ardeo and CampusESP, 2025 Prospective Family Engagement Report. 14 (vendor research).
- EAB, Targeted Yield Performance Turnarounds.