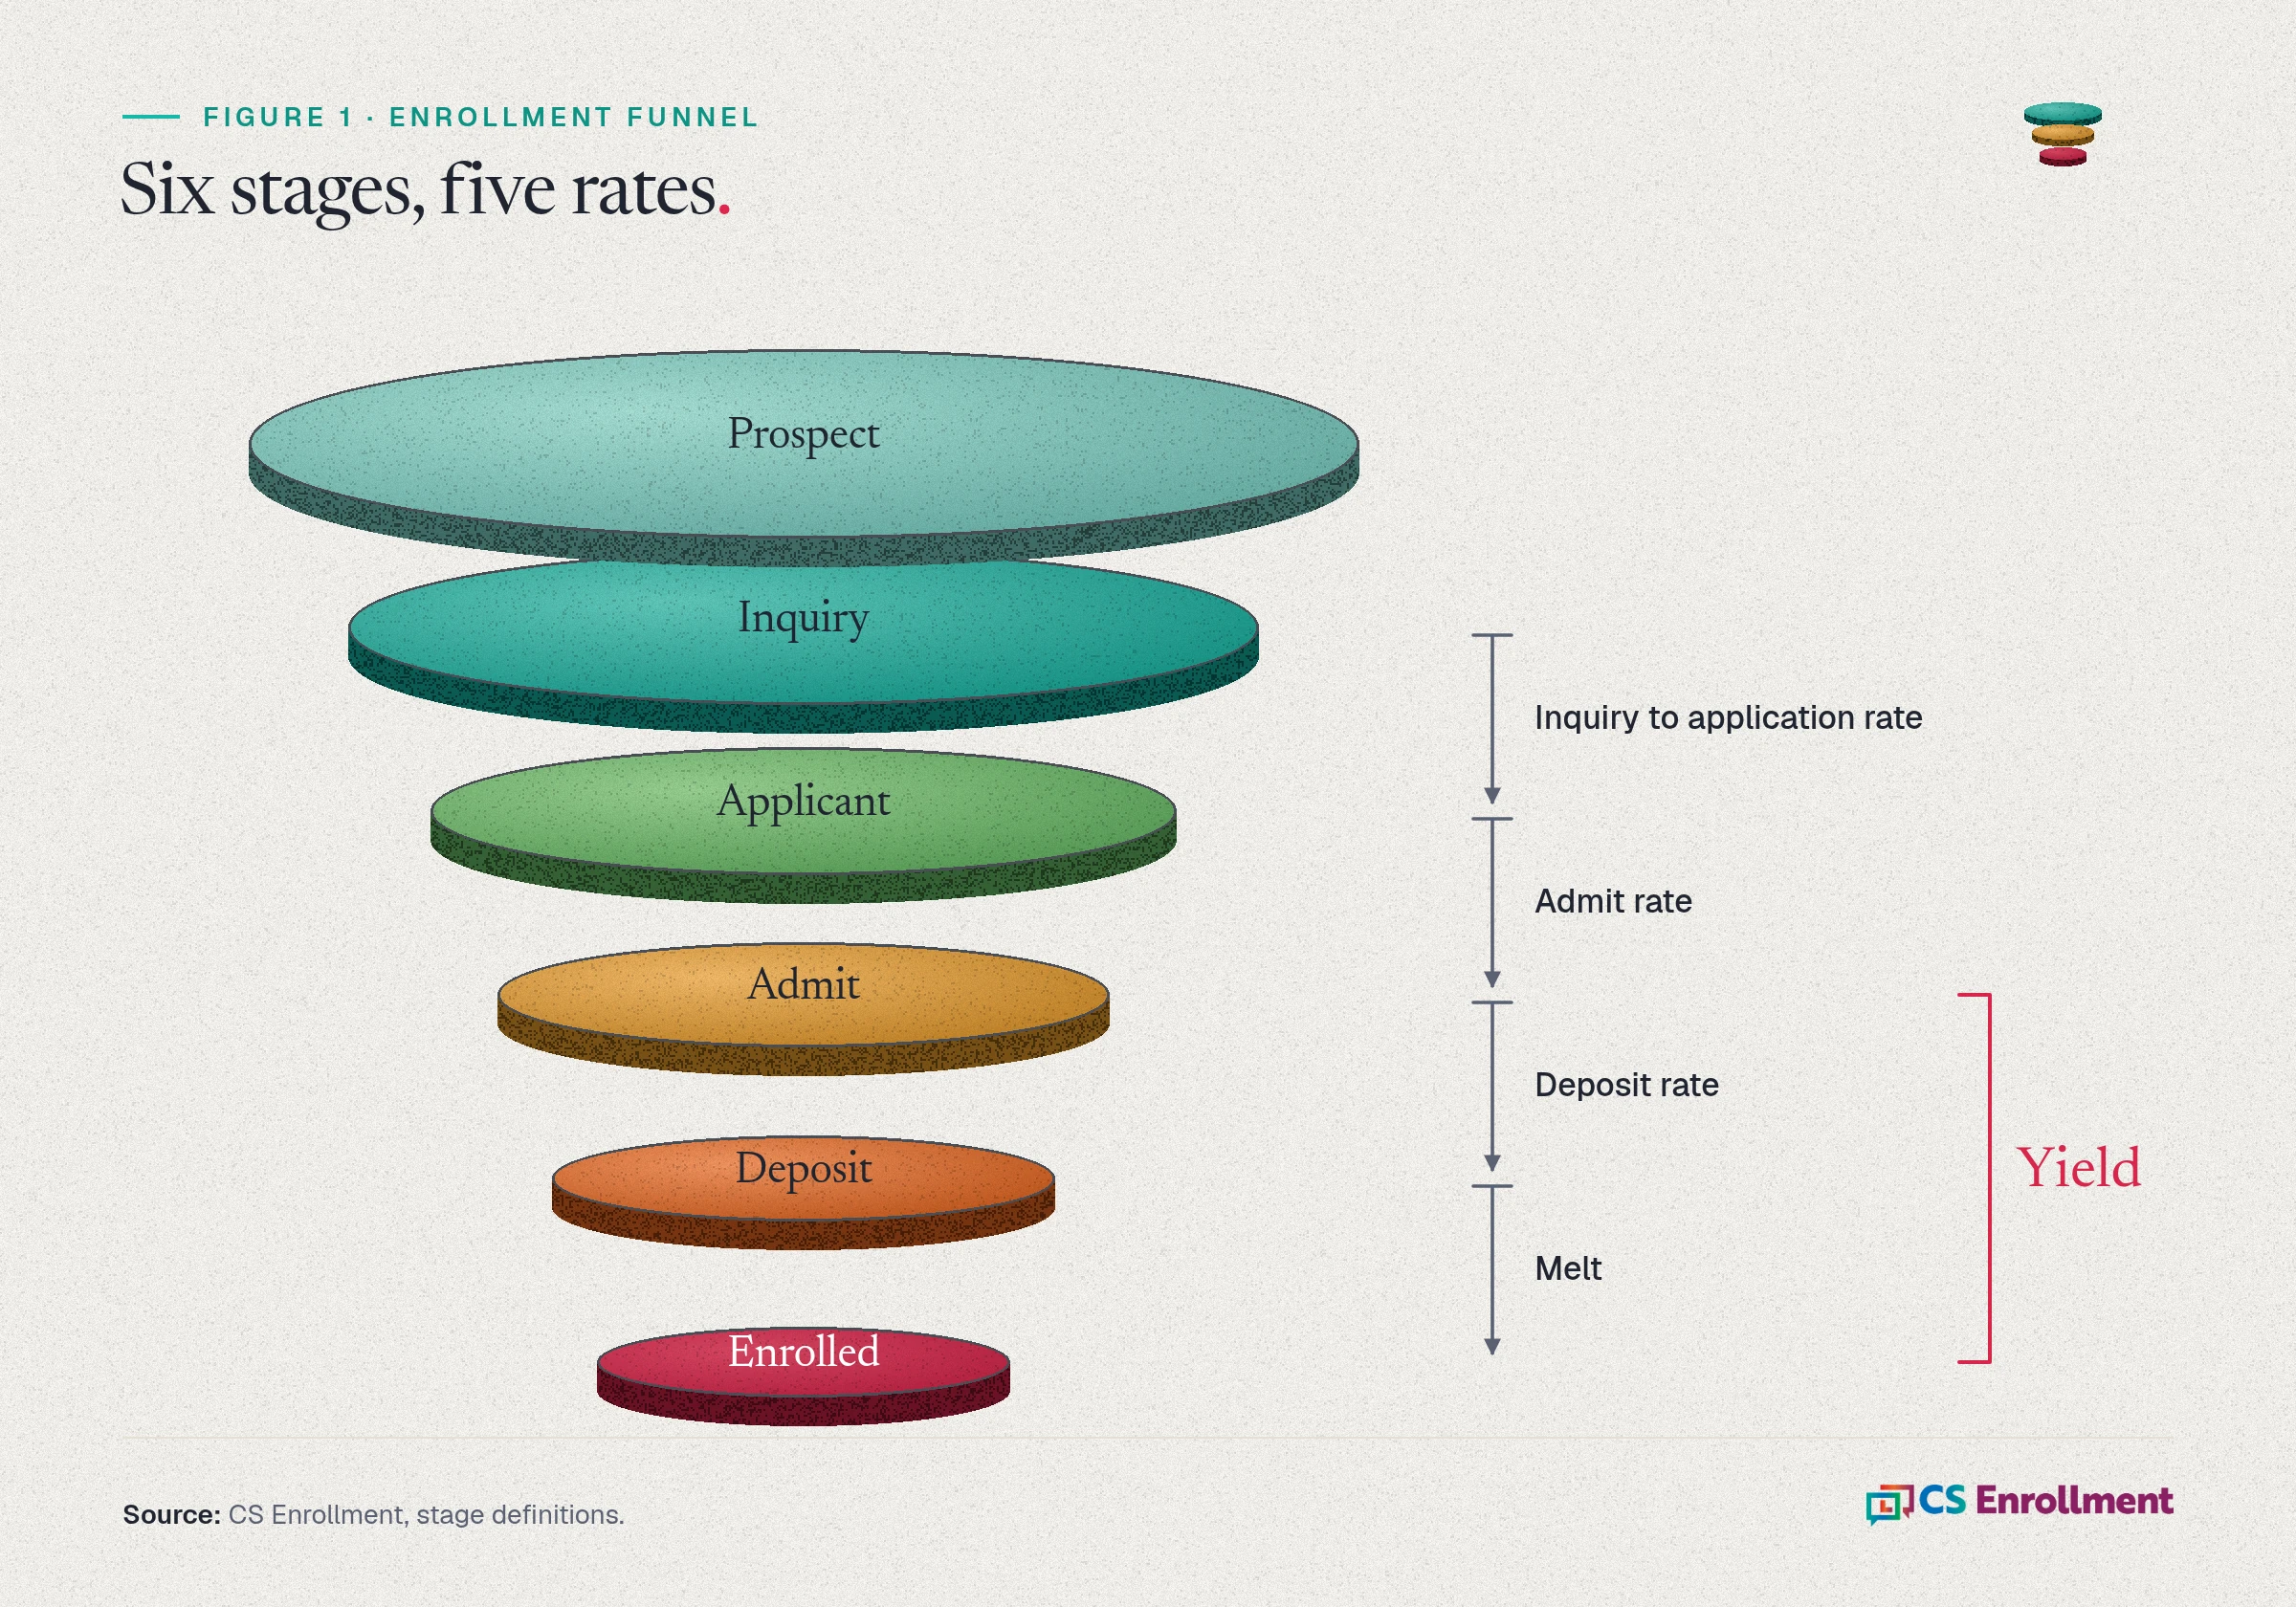
The short answer: The enrollment funnel has six stages: prospect, inquiry, applicant, admit, deposit and enrolled, and the loss between deposit and the first day of class is called melt. Each step between two stages has its own conversion rate, and a college improves enrollment by finding the step where it loses the most students.
What is the enrollment funnel?
The enrollment funnel is the path from the first time a college knows a student's name to the first day of class. It narrows at every step as students lose interest, are not admitted or choose another college.
Colleges label the stages differently. Some add a "candidate" stage for a completed application, and some say "confirmed" instead of deposit. So write your definitions down and keep them the same every year, so this year's inquiry means what last year's did.
What are the six stages of the enrollment funnel?
- Prospect. A student you know about who has not contacted you. How they get there: purchased names, college fair lists, referrals. Number to track: prospects by source.
- Inquiry. A student who has contacted you or responded. How they get there: a form, an event registration, a reply to outreach. Number to track: inquiries by source.
- Applicant. A student who submitted an application. How they get there: applying; "complete" once every document is in. Number to track: applications, complete applications.
- Admit. A student offered admission. How they get there: an admission decision. Number to track: admits.
- Deposit (or confirmed). A student who committed, usually with a deposit. How they get there: paying the deposit or confirming. Number to track: deposits.
- Enrolled. A student attending on the census date. How they get there: staying through census. Number to track: enrolled students.
Melt is the gap between the last two rows: students who committed and never arrived.
What should you measure at each stage?
Five rates cover the whole funnel. Written in words:
- Inquiry to application rate: applications divided by inquiries.
- Admit rate: admits divided by applications.
- Yield: enrolled students divided by admits. NACAC, using IPEDS data, defines yield as "the percentage of admitted students who ultimately enroll at the institution."
- Deposit rate: deposits divided by admits.
- Melt rate: deposited students who did not enroll, divided by deposited students.
Keep yield and the deposit rate separate. Yield, as NACAC defines it using IPEDS data, is the share of admitted students who enroll. The deposit rate is a different metric: the share of admits who commit. Label both on every report, and use the IPEDS definition of yield when you compare your college with anyone else.
What are typical enrollment funnel conversion rates?
The best public benchmarks are old or come from vendors. Treat them as a sanity check.
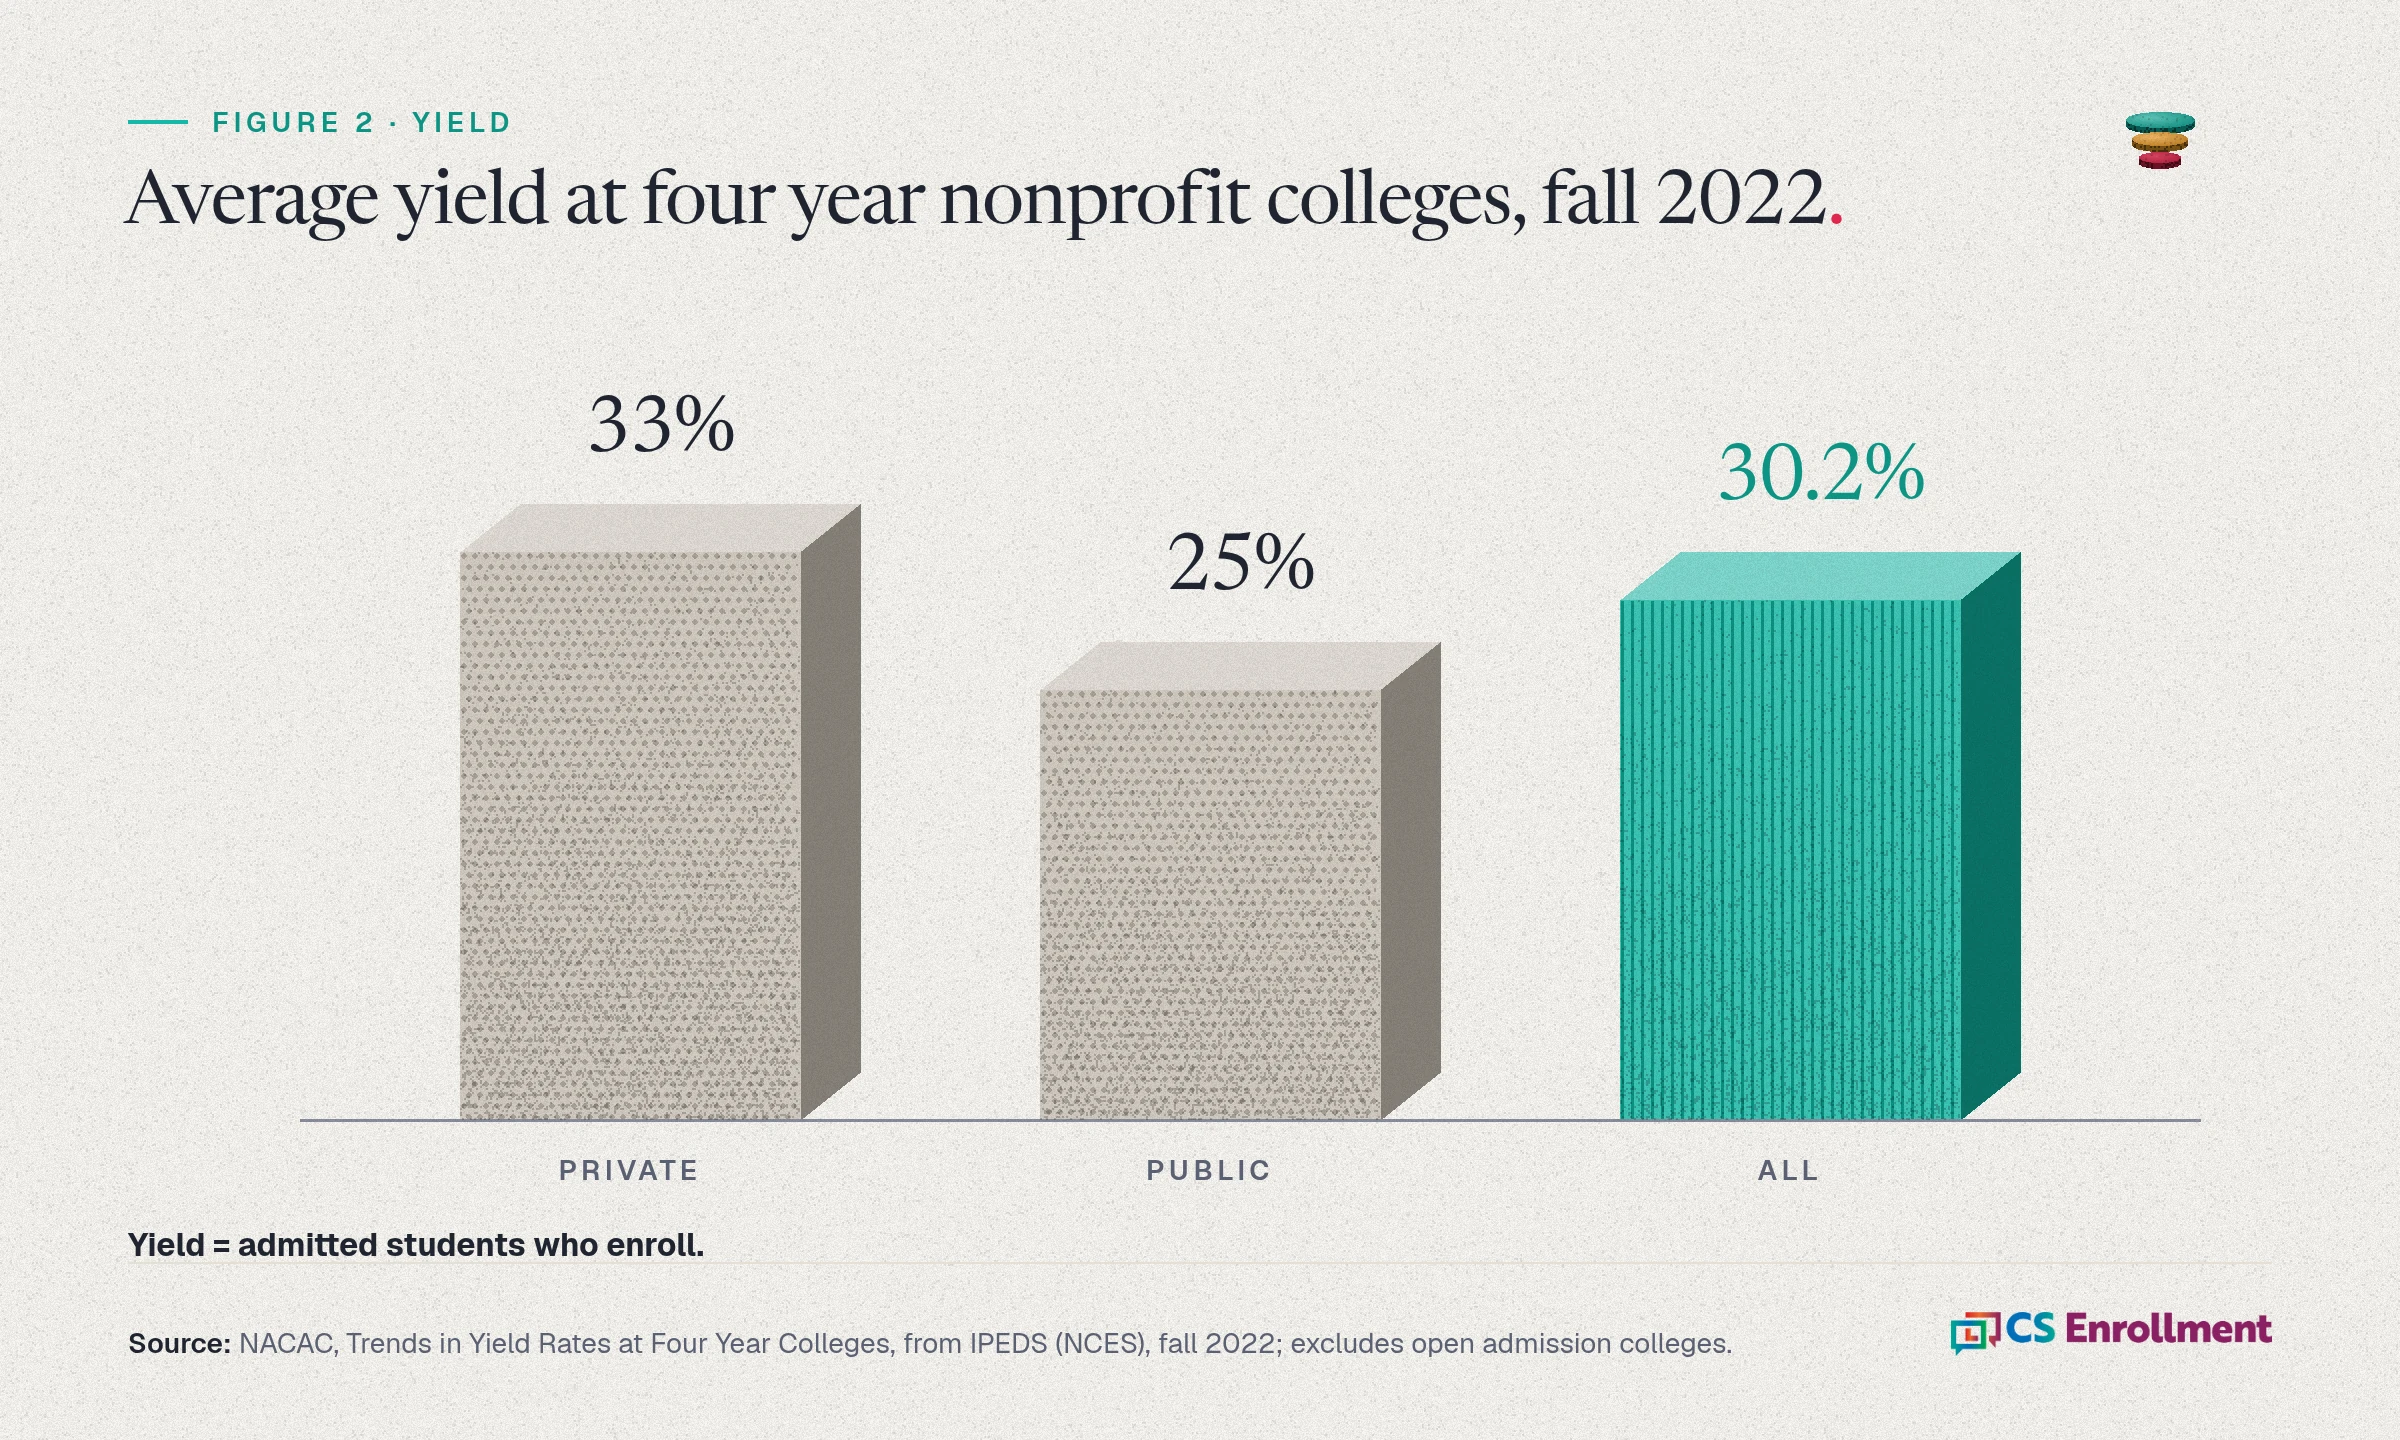
- Yield, four year nonprofit colleges (public and private). 30.2% average; 33% at private colleges, 25% at public colleges. Source and date: NACAC from IPEDS, fall 2022.
- Yield, same group, earlier. 32.1%. Source and date: NACAC from IPEDS, fall 2019.
- Inquiry to application, private four year median (all inquiries, counting stealth applicants). 14% (10% when stealth applicants are left out). Source and date: RNL poll of 64 private colleges, fall 2018 (vendor research).
- Application to admit, private four year median. 58%. Source and date: RNL, fall 2018 (vendor research).
- Yield, private four year median. 25%. Source and date: RNL, fall 2018 (vendor research).
- Melt, private four year median. 9%. Source and date: RNL, fall 2018 (vendor research).
- Melt, national estimate. about 10% to 20% of students who intend to go to college. Source and date: EdResearch for Action.
NACAC's figures leave out open admission colleges. RNL's are medians for full time, first year students from a fall 2018 poll (vendor research), in which each college defined its confirmed stage its own way. Neither describes your market this year.
The benchmark that matters is your own trend. Compare each rate with the same date in your last three cycles.
Why doesn't every applicant start as an inquiry?
Because of stealth applicants: students who apply without contacting the college first. In RNL's fall 2018 poll, a median of 33% of applicants to private four year colleges, about one in three, had not identified themselves before applying. That is vendor research from 2018 data.
Students also apply more widely now. The Common App reports 7.06 applications per first year applicant in 2025 to 2026, up from 6.79 the year before. An application is a weaker sign of intent than it used to be.
Count stealth applicants separately. Folding them into your inquiry pool after the fact makes your inquiry to application rate look better than your outreach earned.
Where do small colleges lose the most students?
Every stage leaks. Here is one leak and one move for each step.
Prospect to inquiry. A purchased name is a guess, not a student in market. The move is to ask a question instead of sending a brochure; our post on survey led student search explains why. CS Enrollment Pathways opens with a short survey sent as branded, verified messages, so a prospect becomes an inquiry by answering a real question, and the office learns which students are in market and what they want before the application stage. The same approach works at the admit and deposit stages to find who is still undecided.
Inquiry to application. A student who reaches out and waits days for a reply may move on. Answer every inquiry quickly, from a person, and track your response time weekly.
Application to admit. Incomplete files stall here. Chase missing transcripts and forms with a short checklist and a named contact.
Admit to deposit. This is the yield fight. Ask admits whether they plan to enroll. In EAB research from 2021, which is vendor research, about three quarters of admits who answered "yes" enrolled, against about 1% of those who answered "no." Our post on how to increase college yield lays out the full plan.
Deposit to enrolled. This is melt. In RNL's 2024 Discounting Report, which covers 2023 data for first year students at 155 private colleges that are RNL clients, students who did not file a FAFSA had a melt rate of 30.4%, against 11.1% for FAFSA filers. That is vendor research and a correlation, not proof that filing causes enrollment, but it shows where summer outreach belongs. See how to reduce summer melt.
The whole funnel. Fake applicants inflate the top and distort every rate below it. Our post on how colleges spot ghost students shows what to check.
Do more applications mean a better funnel?
Not by themselves. Of the four year colleges whose applications grew from 2023 to 2024, 78% saw yield fall, yet 58% still enrolled more students (Jennifer Wick, IPEDS analysis of 1,149 institutions). Volume can hide a weaker funnel, so watch the rates as well as the counts.
How does the demographic cliff change the funnel?
WICHE projects that U.S. high school graduates peaked in 2025 and will decline 13% through 2041. That is a projection of graduates, not enrollment, but in most regions it means a smaller top of the funnel, so conversion at every step matters more. Our post on what the demographic cliff means for small colleges covers the regional picture.
How do you build a simple funnel report?
A two or three person office can run this in a spreadsheet:
1. One row per stage, from prospect to enrolled.
2. Counts for this cycle and the last three cycles, all pulled on the same date.
3. The conversion rate between each pair of stages.
4. A split by source: search names, campus visits, fairs, transfers and stealth applicants.
5. A split by county or state.
6. A review every two weeks during the season, with one owner for the stage that loses the most students.
For where inquiries come from now, see how students find colleges through AI answers.
Frequently asked questions
What are the stages of the enrollment funnel? There are six: prospect, inquiry, applicant, admit, deposit and enrolled. The loss between deposit and enrolled is called melt.
What is the difference between a prospect and an inquiry? A prospect has not contacted you yet. An inquiry has contacted you or responded to your outreach.
What is yield in college admissions? Yield is the share of admitted students who enroll, the definition NACAC and IPEDS use. The share of admits who deposit is a separate metric, the deposit rate.
What is a good yield rate? NACAC, using IPEDS data, reports an average yield of 30.2% at four year nonprofit colleges in fall 2022, and 33% at private colleges. The better test is your own yield against your last three cycles.
What is summer melt? Melt is when a student who committed to a college does not enroll in the fall. EdResearch for Action estimates that nationally about 10% to 20% of students who intend to go to college do not enroll that fall.
What is a stealth applicant? A student who applies without contacting the college first. In RNL's fall 2018 poll (vendor research), about one in three private college applicants were stealth applicants.
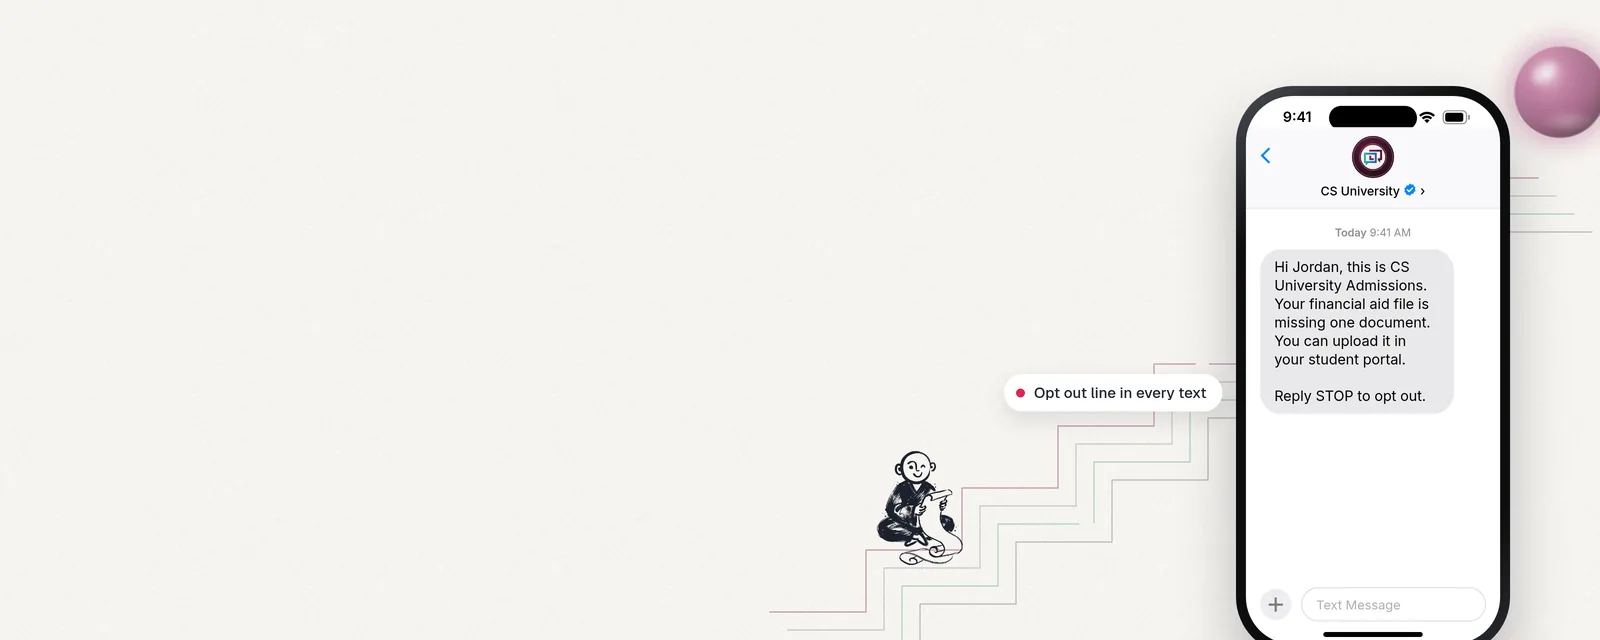
To see how a short survey looks on a student's phone, request the sample walkthrough.
Sources
- National Association for College Admission Counseling, Trends in Yield Rates at Four Year Colleges.
- RNL, 2019 Conversion and Yield Rate Benchmarks for Four Year Institutions. 3, 4, 10 and 11 (vendor research).
- RNL, 2024 Discounting Report. 2, 4, 12 and 13 (vendor research).
- Lindsay Page, Katharine Meyer, Aizat Nurshatayeva and Ellen Bryer, Helping Students Make It to College, a research brief on design principles for reducing summer melt.
- EAB, Targeted Yield Performance Turnarounds. 11 (vendor research).
- Common App, End of Season Report, 2025 to 2026: First Year Application Trends.
- Jennifer Wick, Evaluating the Return on Application Growth.
- WICHE, Knocking at the College Door key findings: graduates.