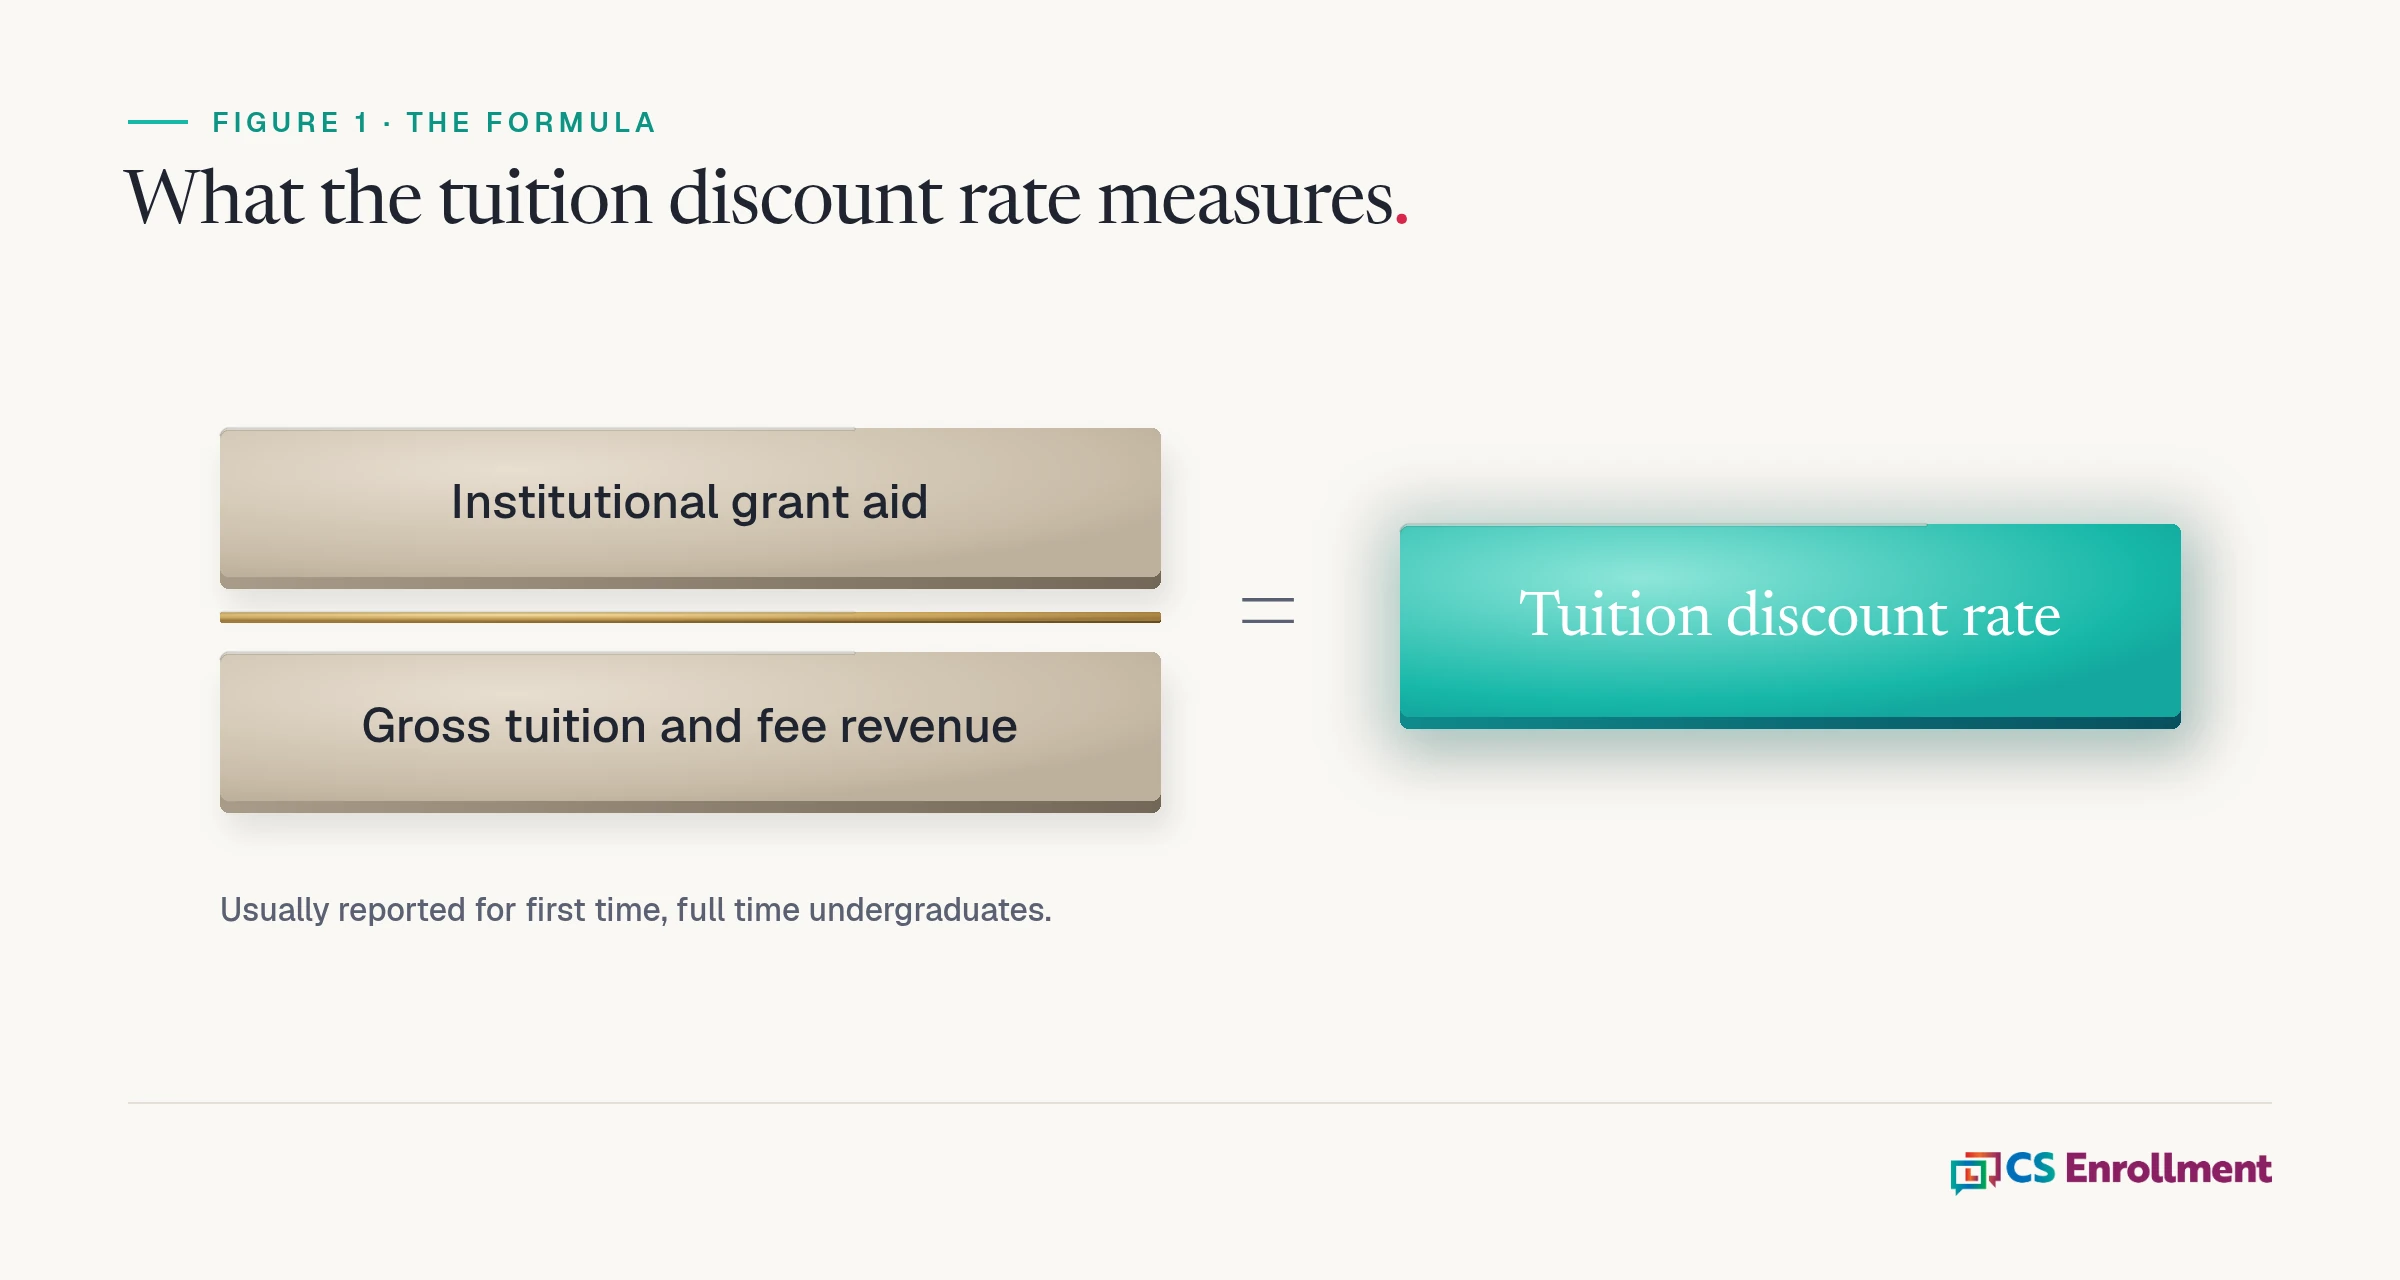
The short answer: The tuition discount rate is institutional grant aid divided by gross tuition and fee revenue, usually reported for first time, full time undergraduates. A rising rate only helps if it enrolls students who would not have come otherwise and raises net tuition revenue; past that point, more aid is a price cut, not a yield strategy.
That is the frame for the rest of this post. The discount rate tells you what you charged. It does not tell you why a student said yes.
How is the tuition discount rate calculated?
Add up the institutional grant aid you award (your own money, not federal or state grants), then divide it by the gross tuition and fees you would have collected at the published price.
Illustrative example, round numbers, not real data: a college with a published tuition of $40,000 enrolls 100 first year students. Gross tuition is $4 million. If it awards $2 million in institutional grants, its first year discount rate is 50%, and it collects $2 million in net tuition.
Two versions get reported. The first time, full time rate covers the entering class, where awards are usually largest. The all undergraduate rate covers every enrolled undergraduate and usually runs lower, because aid for continuing students is often set earlier. Know which one a report uses before you compare.
What is the average discount rate at private colleges right now?
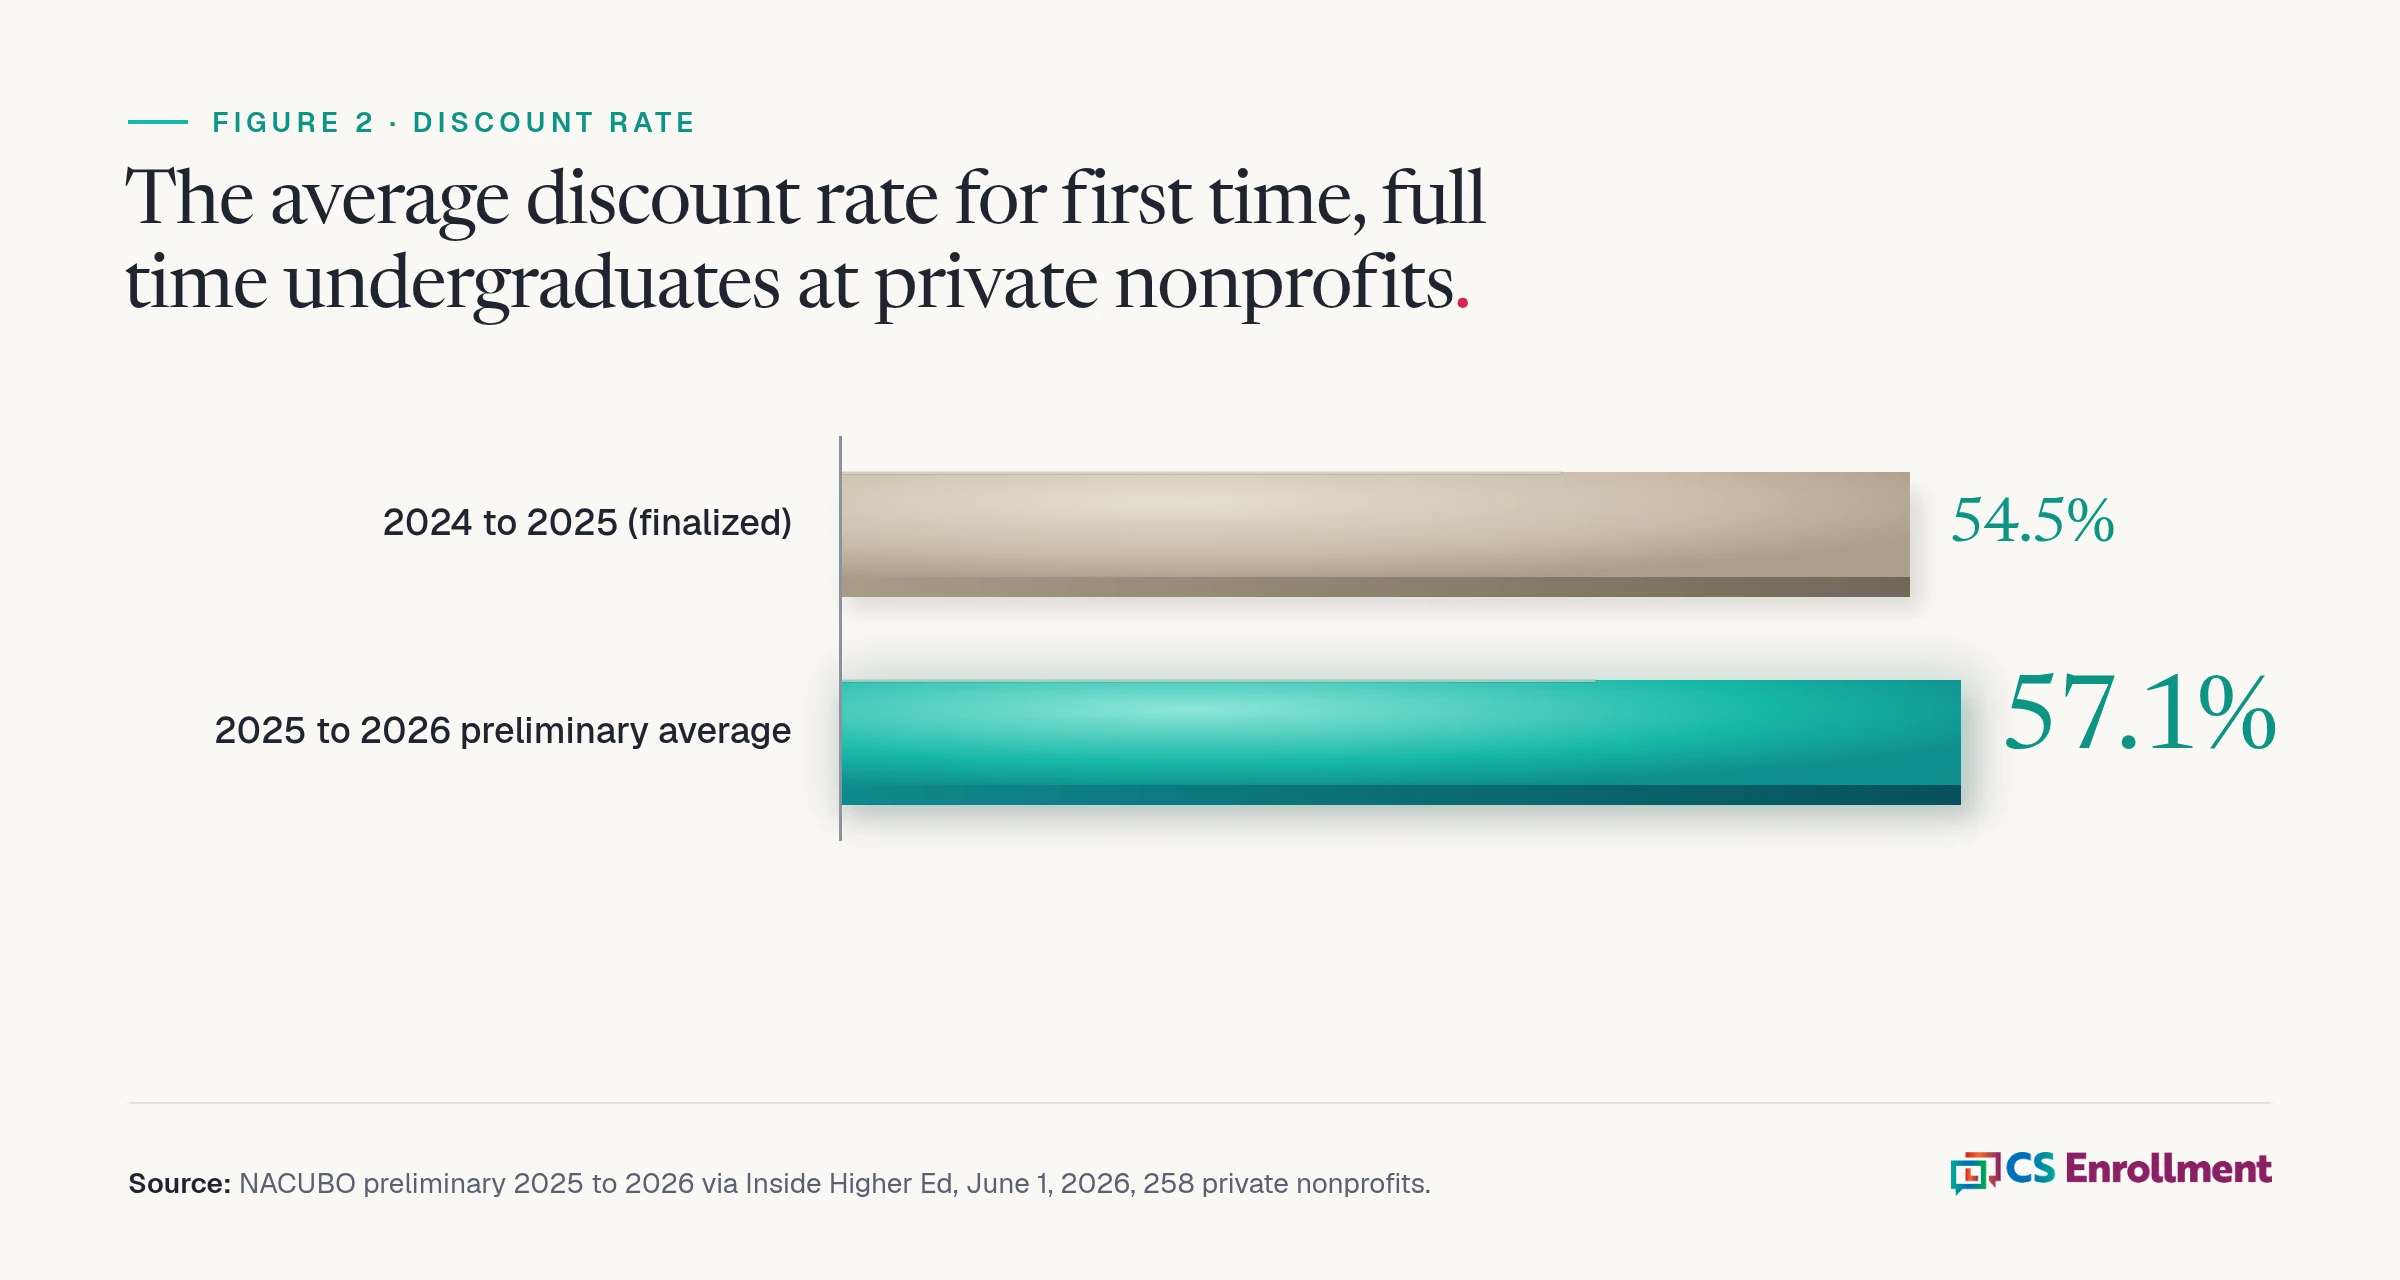
According to preliminary NACUBO data reported by Inside Higher Ed, the average discount rate for first time, full time undergraduates at private nonprofit colleges reached 57.1% in 2025 to 2026, up from 54.5% in 2024 to 2025, across 258 institutions. NACUBO also found that net tuition and fee revenue per first time, full time undergraduate fell 2.2% between 2023 to 24 and 2024 to 25 (1.9% for all undergraduates), at the 258 private nonprofit colleges in its 2025 study.
Those figures cover different years, but they point the same way. Colleges are giving away more of the sticker price, and the revenue left per new student has been shrinking.
Size matters too. In Niche's July 2026 pulse survey of 134 enrollment leaders (vendor research), the median discount rate was 63% at colleges with fewer than 2,000 students, compared with 34% at colleges with more than 5,000. That is a different sample and a median, so it does not line up directly with the NACUBO average.
Does more discounting raise yield?
Not reliably. In Niche's July 2026 pulse survey of 134 enrollment leaders (vendor research), 48% of colleges that relied on increased discounting hit their deposit targets, compared with 67% of those that did not. That is a correlation, not proof that discounting caused the miss. Colleges under pressure may be the ones reaching for aid in the first place. Still, it is hard to read as evidence that a bigger award reliably fills a class. Anecdotes point the same way: several enrollment leaders told Jeff Selingo at this fall's NACAC conference that they put more aid on the table late and, in their words, "spent more money to enroll a smaller class." That is what a few leaders reported, not a trend measured in data.
For context, NACAC's analysis of IPEDS data put the average yield at private four year colleges at 33% in fall 2022. Most admitted students go somewhere else, at almost any price. For more on what moves that number, see how to increase college yield.
Signs your next aid dollar isn't working
None of these needs a new study. Most can be pulled from your own funnel data:
- Yield stays flat while the discount rate climbs. You are paying more for the same class.
- Net tuition per student keeps falling. The extra aid is not bringing in enough added students to cover itself.
- Admitted students never open the aid letter. An award nobody reads cannot change a decision.
- Deposits cluster in the highest award bands. Students at middle award levels may be deciding on something other than price.
- Melt rises after aid is packaged. Families who deposit and then disappear often had unanswered cost questions.
Measuring each stage separately makes these signs visible. Our guide to enrollment funnel stages walks through how.
What works before raising the award?
Explain aid early and plainly. Many families cannot tell what they will actually pay from an award letter. Show net cost in one line, before the details.
Bring families into the conversation. Parents often make or shape the cost decision. Give them their own way to ask questions.
Ask admitted students about intent. EAB (vendor research, 2021) found that about three quarters of students who answer "yes" to a simple intent question go on to enroll, compared with just 1% of those who answer "no". Knowing who is undecided tells you where a conversation, not a larger award, can matter. A survey led approach to student search uses the same idea earlier in the funnel.
Push FAFSA completion. RNL's 2024 Discounting Report (vendor research, first year students at 155 private client colleges, 2023 data) found a 30.4% melt rate among students who did not file a FAFSA, compared with 11.1% for filers. Yield was 28.2% for filers and 5.9% for non filers. Again, that is a correlation, but filing is a clear signal of intent and a step you can help with. See how to reduce summer melt.
Make it easy to ask about the award. Aid only changes a decision when the student and family actually read it and can ask a question. CS Enrollment Pathways sends branded, verified text messaging so admitted students can ask about their award and get a real answer from the admissions office.
How do small colleges talk about price without leading with the discount?
Lead with what the student will pay and what they get for it. Net price is clearer than a percentage off a sticker few families pay. Pair it with outcomes you can document and a named person who answers questions. That combination gives a family a reason to choose you that a competitor cannot match by raising its award. More ideas are in our posts on enrollment marketing strategies for small colleges and the demographic cliff.
FAQ
What is a good tuition discount rate? There is no single good number. A rate is healthy when it enrolls the class you need and net tuition revenue holds or grows. Watch net revenue, not the rate alone.
Is the discount rate the same as financial aid? No. It counts only institutional grant aid, the money a college gives from its own budget. Federal and state grants and loans are not part of it.
Why do private colleges discount so heavily? Published prices are high, competition for each student is intense, and aid is a visible way to respond. Over time, many colleges find that the discount keeps rising without the class growing.
Does discounting hurt net tuition revenue? It can. If added aid does not bring in enough additional students, net tuition per student falls, as it did between 2023 to 24 and 2024 to 25 in NACUBO's data.
See what a clear aid conversation looks like
If you want to see how a short, plain message about cost and next steps looks on a student's phone, request the sample walkthrough.
Sources
- Josh Moody, Tuition Discounting Continues to Climb.
- Johanna Alonso, Where Enrollment Stands as Fall 2026 Approaches. Inside Higher Ed, Aug 5, 2026 (Niche State of Higher Education Pulse Survey, vendor research, 134 enrollment leaders, July 2026).
- RNL, 2024 Discounting Report.
- NACAC, Trends in Yield Rates at Four Year Colleges.
- Jeff Selingo, The State of Higher Ed 2026, in 4 Charts.
- EAB, Targeted Yield Performance Turnarounds.