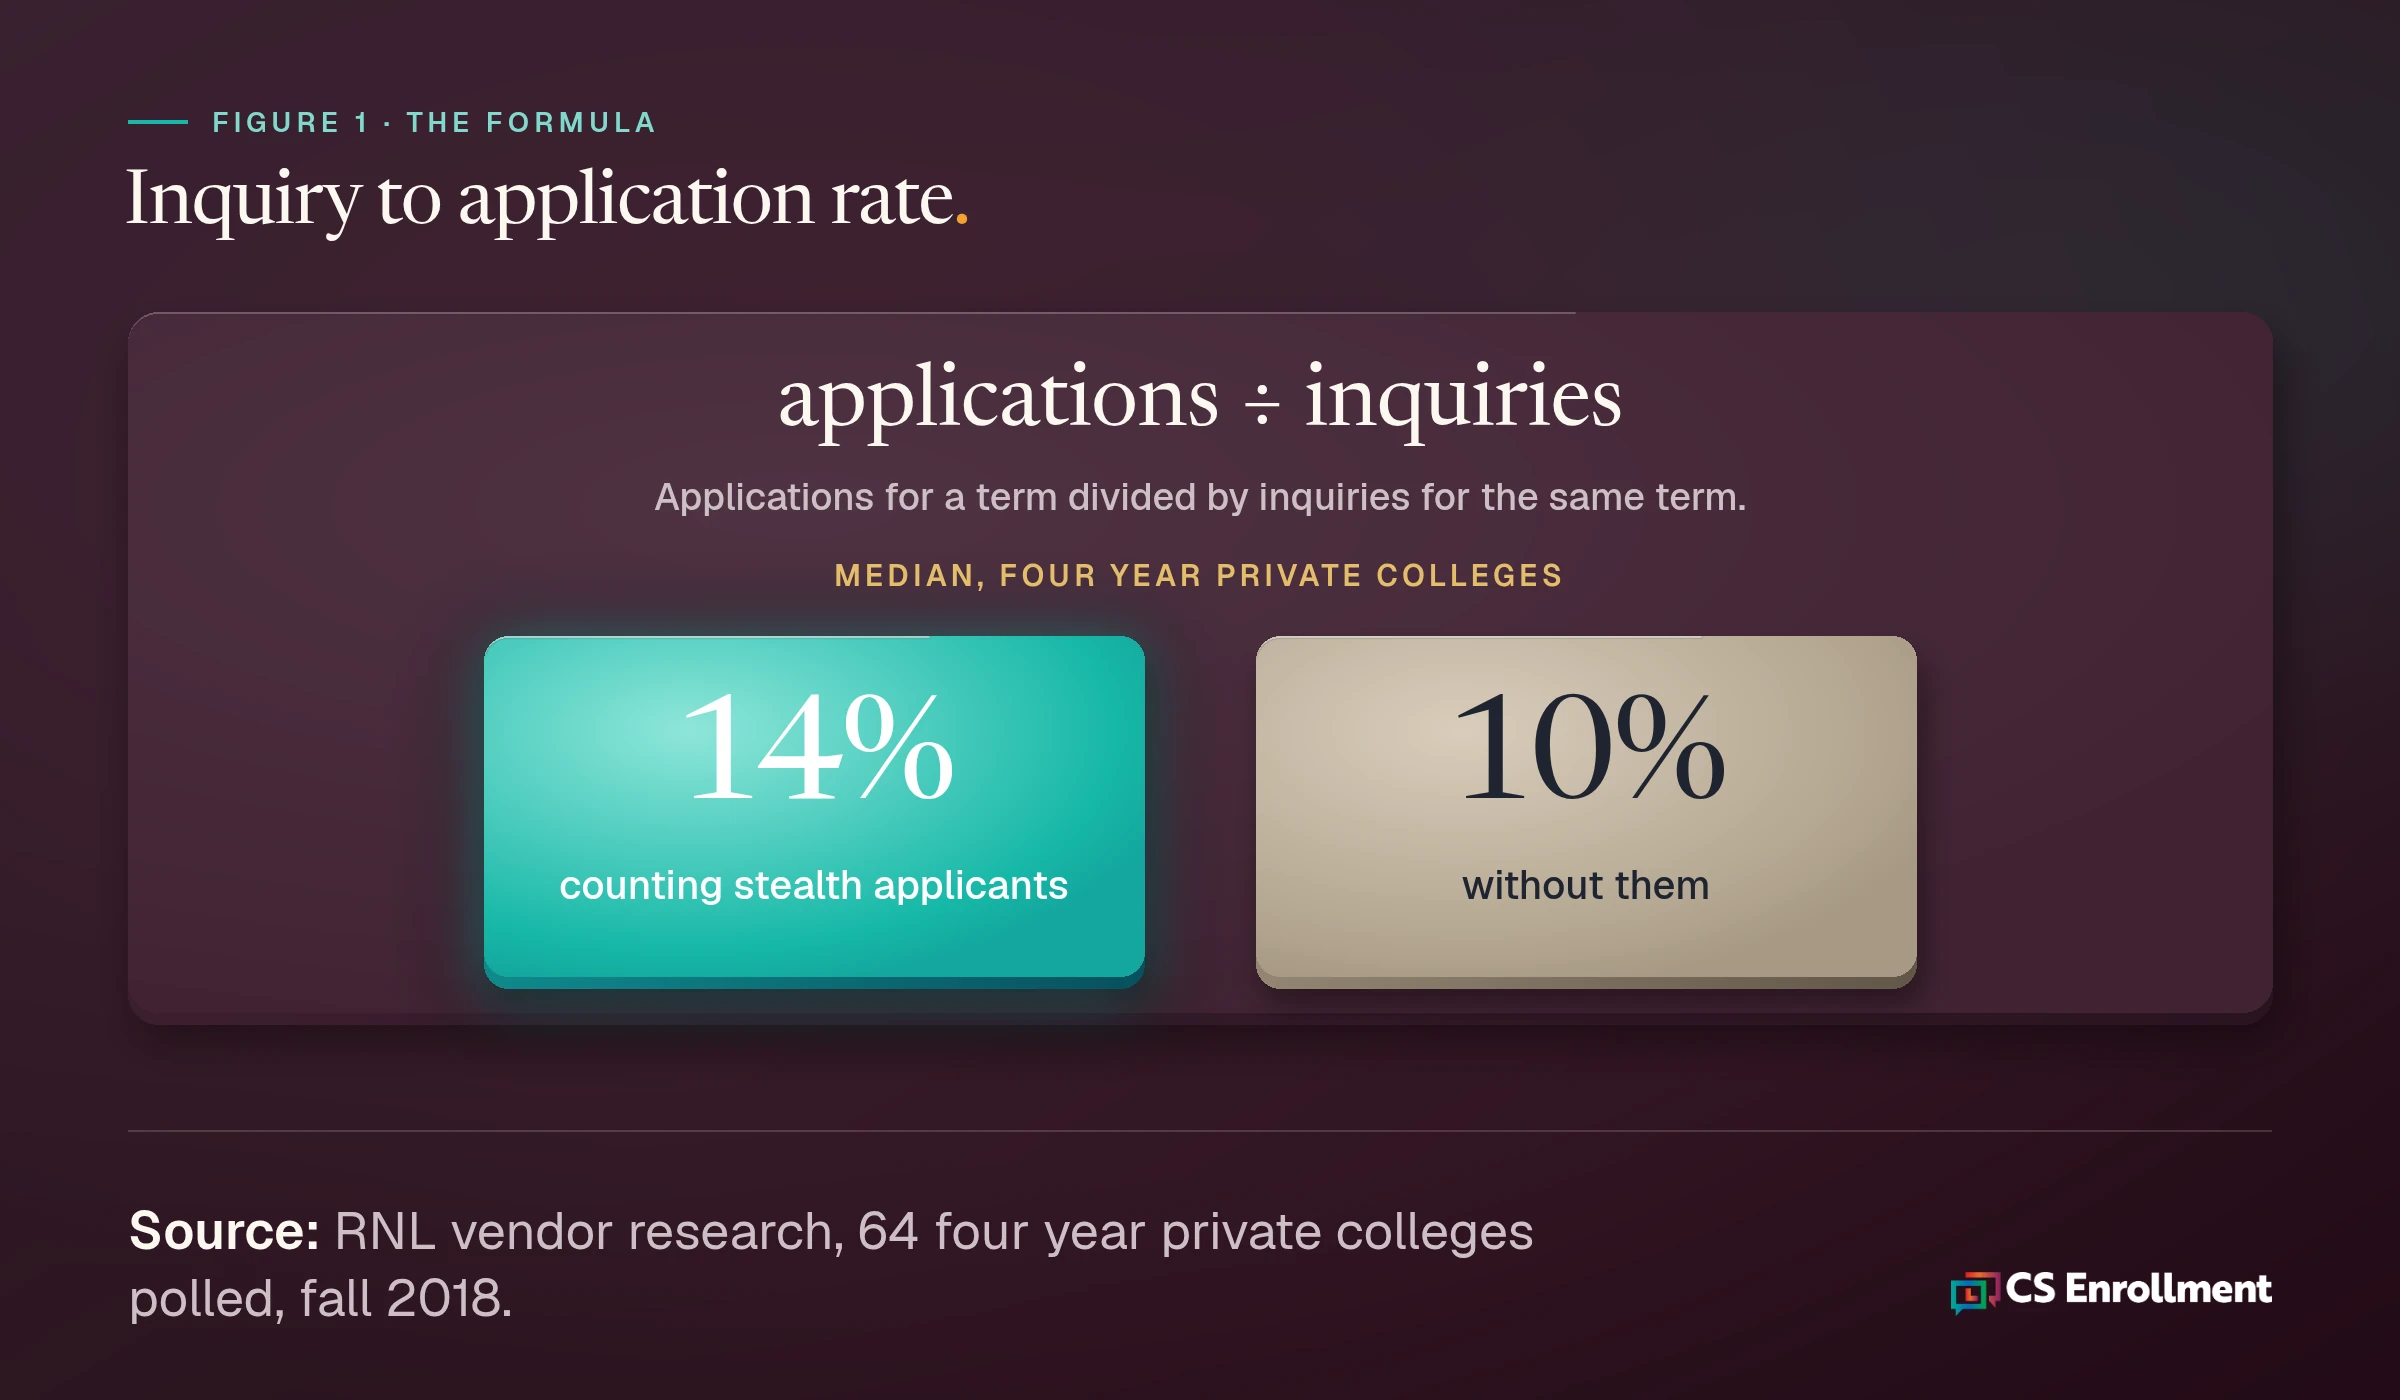
The short answer: Inquiry to application conversion is the number of applications divided by the number of inquiries for the same entry term. Vendor benchmarks put the median for four year private colleges at 14% when stealth applicants are counted, but your own trend, measured the same way every year, matters more than any benchmark.
That benchmark is useful as a rough reference point. It is also old, and every college in it defined an inquiry its own way. The most practical thing an enrollment team can do is calculate its own rate consistently, then work on the moments where interested students drift away.
How do you calculate it?
Take every application for an entry term and divide it by every inquiry for that same term. Keep three things fixed from year to year:
1. The same term. Compare fall to fall, not a calendar year that mixes two classes. 2. The same definition of an inquiry. Decide whether purchased names, event signups and form fills count, write it down, and do not change it quietly. 3. Two versions of the rate. Calculate it once counting every applicant, and once counting only applicants who inquired first.
Here is a worked example with round numbers. This is an example, not data. A college logs 5,000 inquiries for fall and receives 600 applications. That is a 12% rate counting everyone. If 200 of those applicants never inquired before applying, the rate counting only students who inquired first is 400 divided by 5,000, or 8%.
The gap between those two numbers tells you how much of your class arrives without ever raising a hand. Our guide to enrollment funnel stages shows where this ratio sits among the other stages.
What is a typical rate?
In RNL's benchmark report (vendor research, 64 four year private colleges polled, fall 2018), the median inquiry to application rate for four year privates was 14% when stealth applicants were counted and 10% without them.
Treat that as a loose reference. The data is from fall 2018, before large shifts in how students search and apply, and each college defined its terms its own way. A college that counts every purchased name as an inquiry will show a far lower rate than one that counts only students who asked for information. Your rate against your own prior years is the comparison that holds up.
Why do so many applicants never inquire?
In the same RNL report, about 1 in 3 applicants at four year private colleges were stealth applicants, meaning their first contact with the college was the application itself. At public colleges the share was about 1 in 5.
Stealth applicants are real students who simply did their research quietly. They are different from ghost students, which are fake identities used to apply. If you want the difference in detail, see how colleges spot ghost students.
A large stealth share is worth noticing. It can mean students find the college through its website or word of mouth, but it also means your team had no chance to answer their questions before they decided. Some students like them likely decided not to apply at all.
Where does the rate leak?
Most leaks happen in the first days after a student shows interest. These are questions worth checking against your own process:
- How fast does the first reply arrive? Check the time between an inquiry and the first real response, not the automated receipt.
- Does the first message ask anything? A generic brochure link tells the student nothing new and tells you nothing about them.
- How long is the inquiry form? Each extra field is one more reason to stop.
- Is there one clear next step? A message with five links has no next step.
- Which sources convert? A blended rate can hide a strong source and a weak one.
How to improve it: practical steps
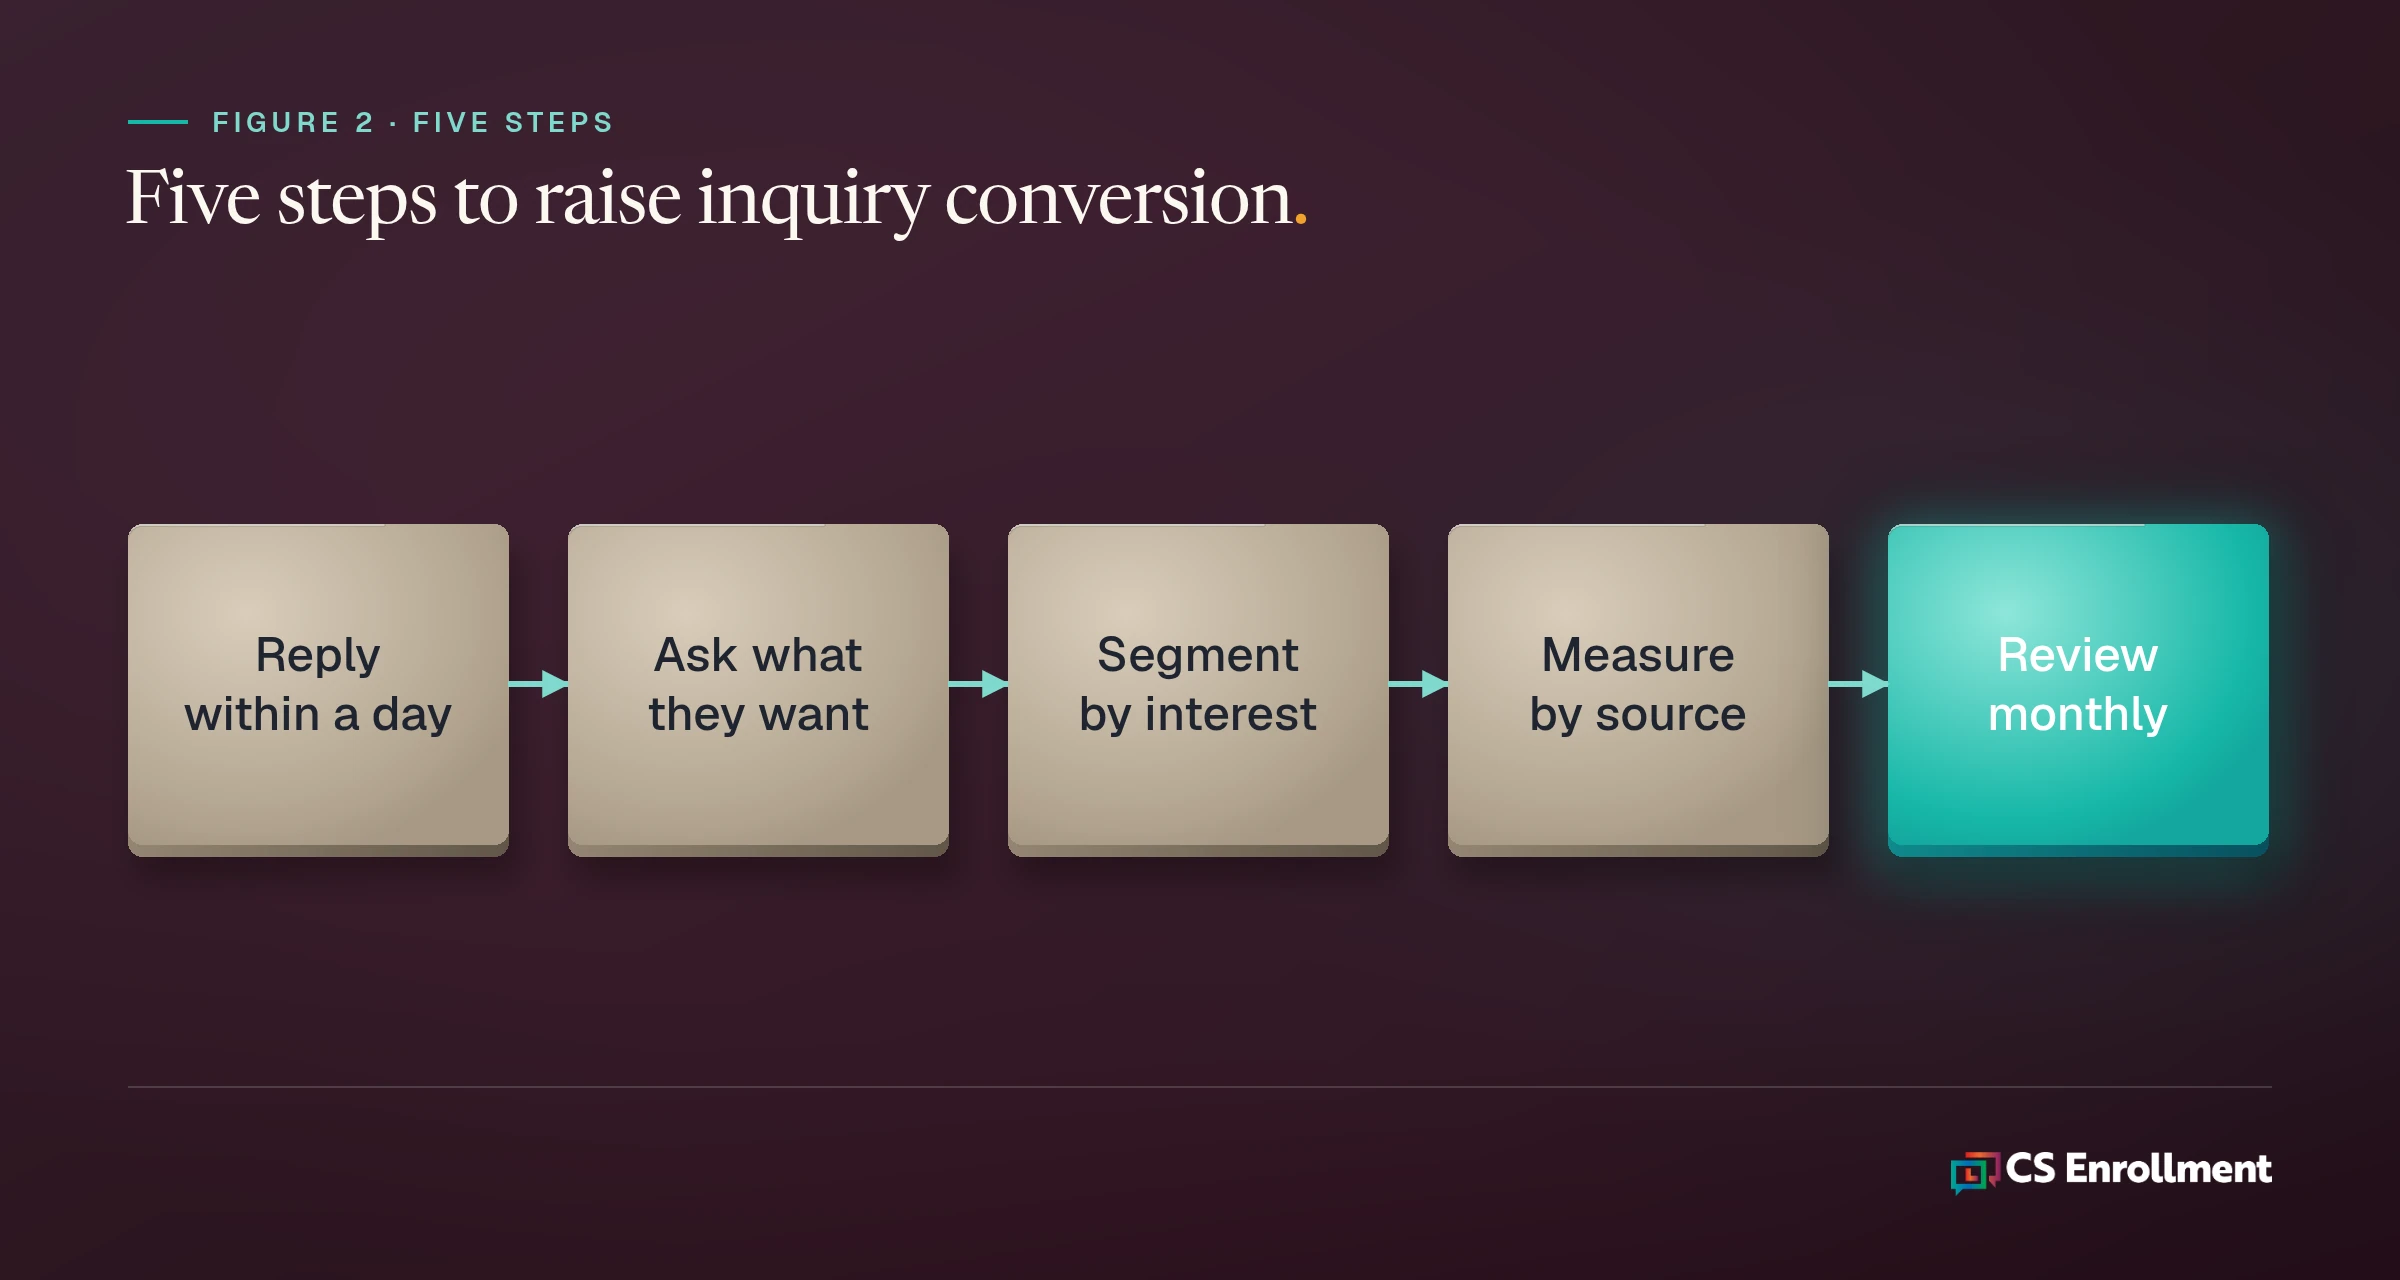
Reply within a day. Set a goal for the first human response and measure it every week. Speed matters most when interest is fresh.
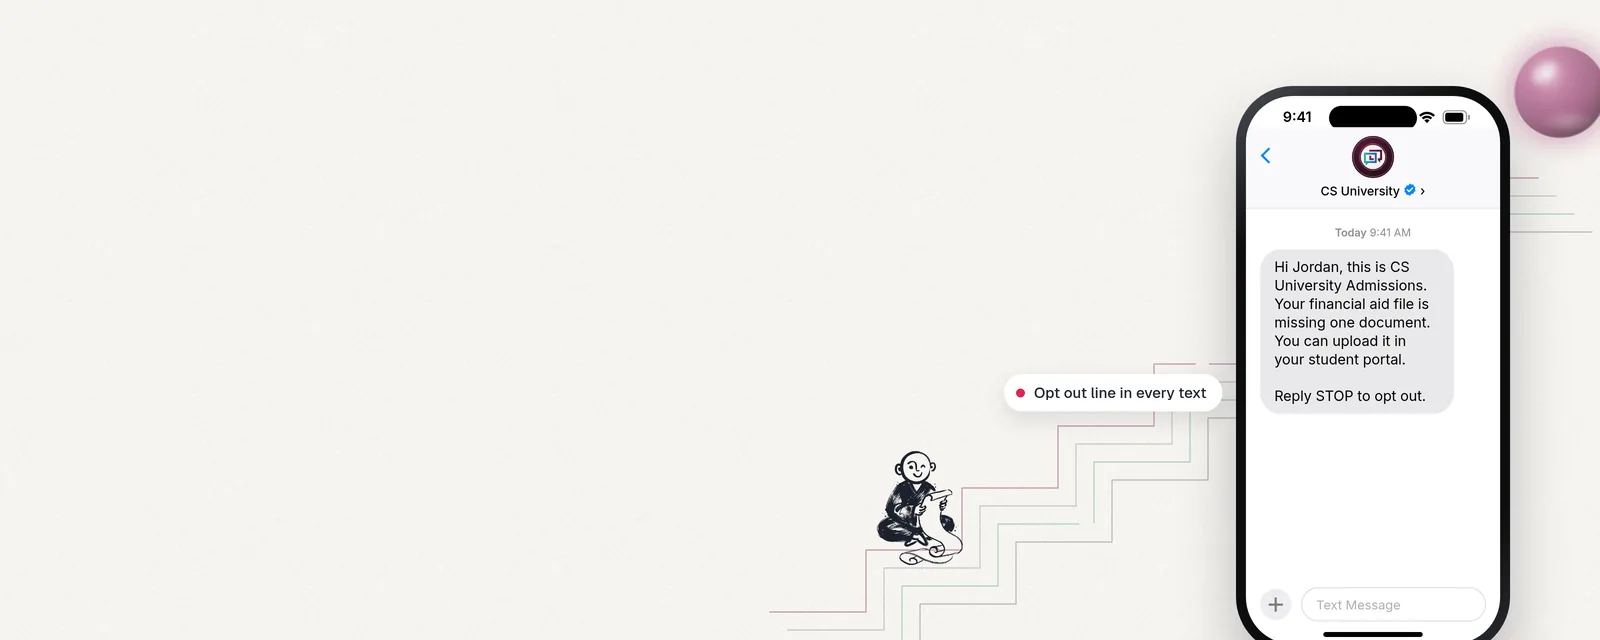
Ask what the student wants in the first message. One or two short questions about program, timing and what they are weighing turn a list name into a conversation. Our post on survey led student search covers how to write them. CS Enrollment Pathways starts with a short survey sent as branded, verified text messaging, so a student tells the college what they want right after they show interest.
Segment by interest. Use those answers to send program specific follow up instead of one sequence for everyone.
Measure by source. Calculate the rate separately for purchased names, events, the website and referrals. Spend more where it converts.
Review monthly. Look at the rate, the stealth share and reply time together each month, and compare with the same month last year.
The same habits help later in the funnel too. For the step after deposit, see our guide on how to reduce summer melt, and for a wider plan, our post on enrollment marketing strategies for small colleges.
FAQ
What is a good inquiry to application rate? Vendor research from fall 2018 put the median for four year private colleges at 14% counting stealth applicants (RNL, 64 private colleges). A good rate for you is one that rises against your own prior years under the same definitions.
Should stealth applicants count? Calculate the rate both ways. The version with stealth applicants shows total demand; the version without shows how well your follow up converts the students you knew about.
How often should we measure it? Monthly during the recruitment cycle, compared with the same month in the prior year.
The bottom line
The benchmark is a starting point. The rate that matters is your own, measured the same way each year, and it improves most when the first reply is fast, personal and asks the student what they want.
See what a short first conversation looks like
To see how a short survey looks on a student's phone, request the sample walkthrough.