How far do students travel for college?
Most undergraduates enroll close to home. In federal data for 2020, the typical undergraduate attended college 17 miles from home, and 69% attended within 50 miles. Students at private nonprofit colleges travel farther. In our reading, that gives a small private college two markets at once: a nearby one and a long tail.
Those figures come from Nick Hillman's brief for The Institute for College Access and Success (TICAS), "How Far Do Students Travel for College?", published October 2023 and built on the federal National Postsecondary Student Aid Study for 2020 (NPSAS:20). The figures cover degree seeking undergraduates at public and private nonprofit colleges who are domestic citizens. For profit and exclusively online institutions are excluded. Distance is measured in straight line miles from a student's permanent home address to the college.
What the federal data shows by type of college
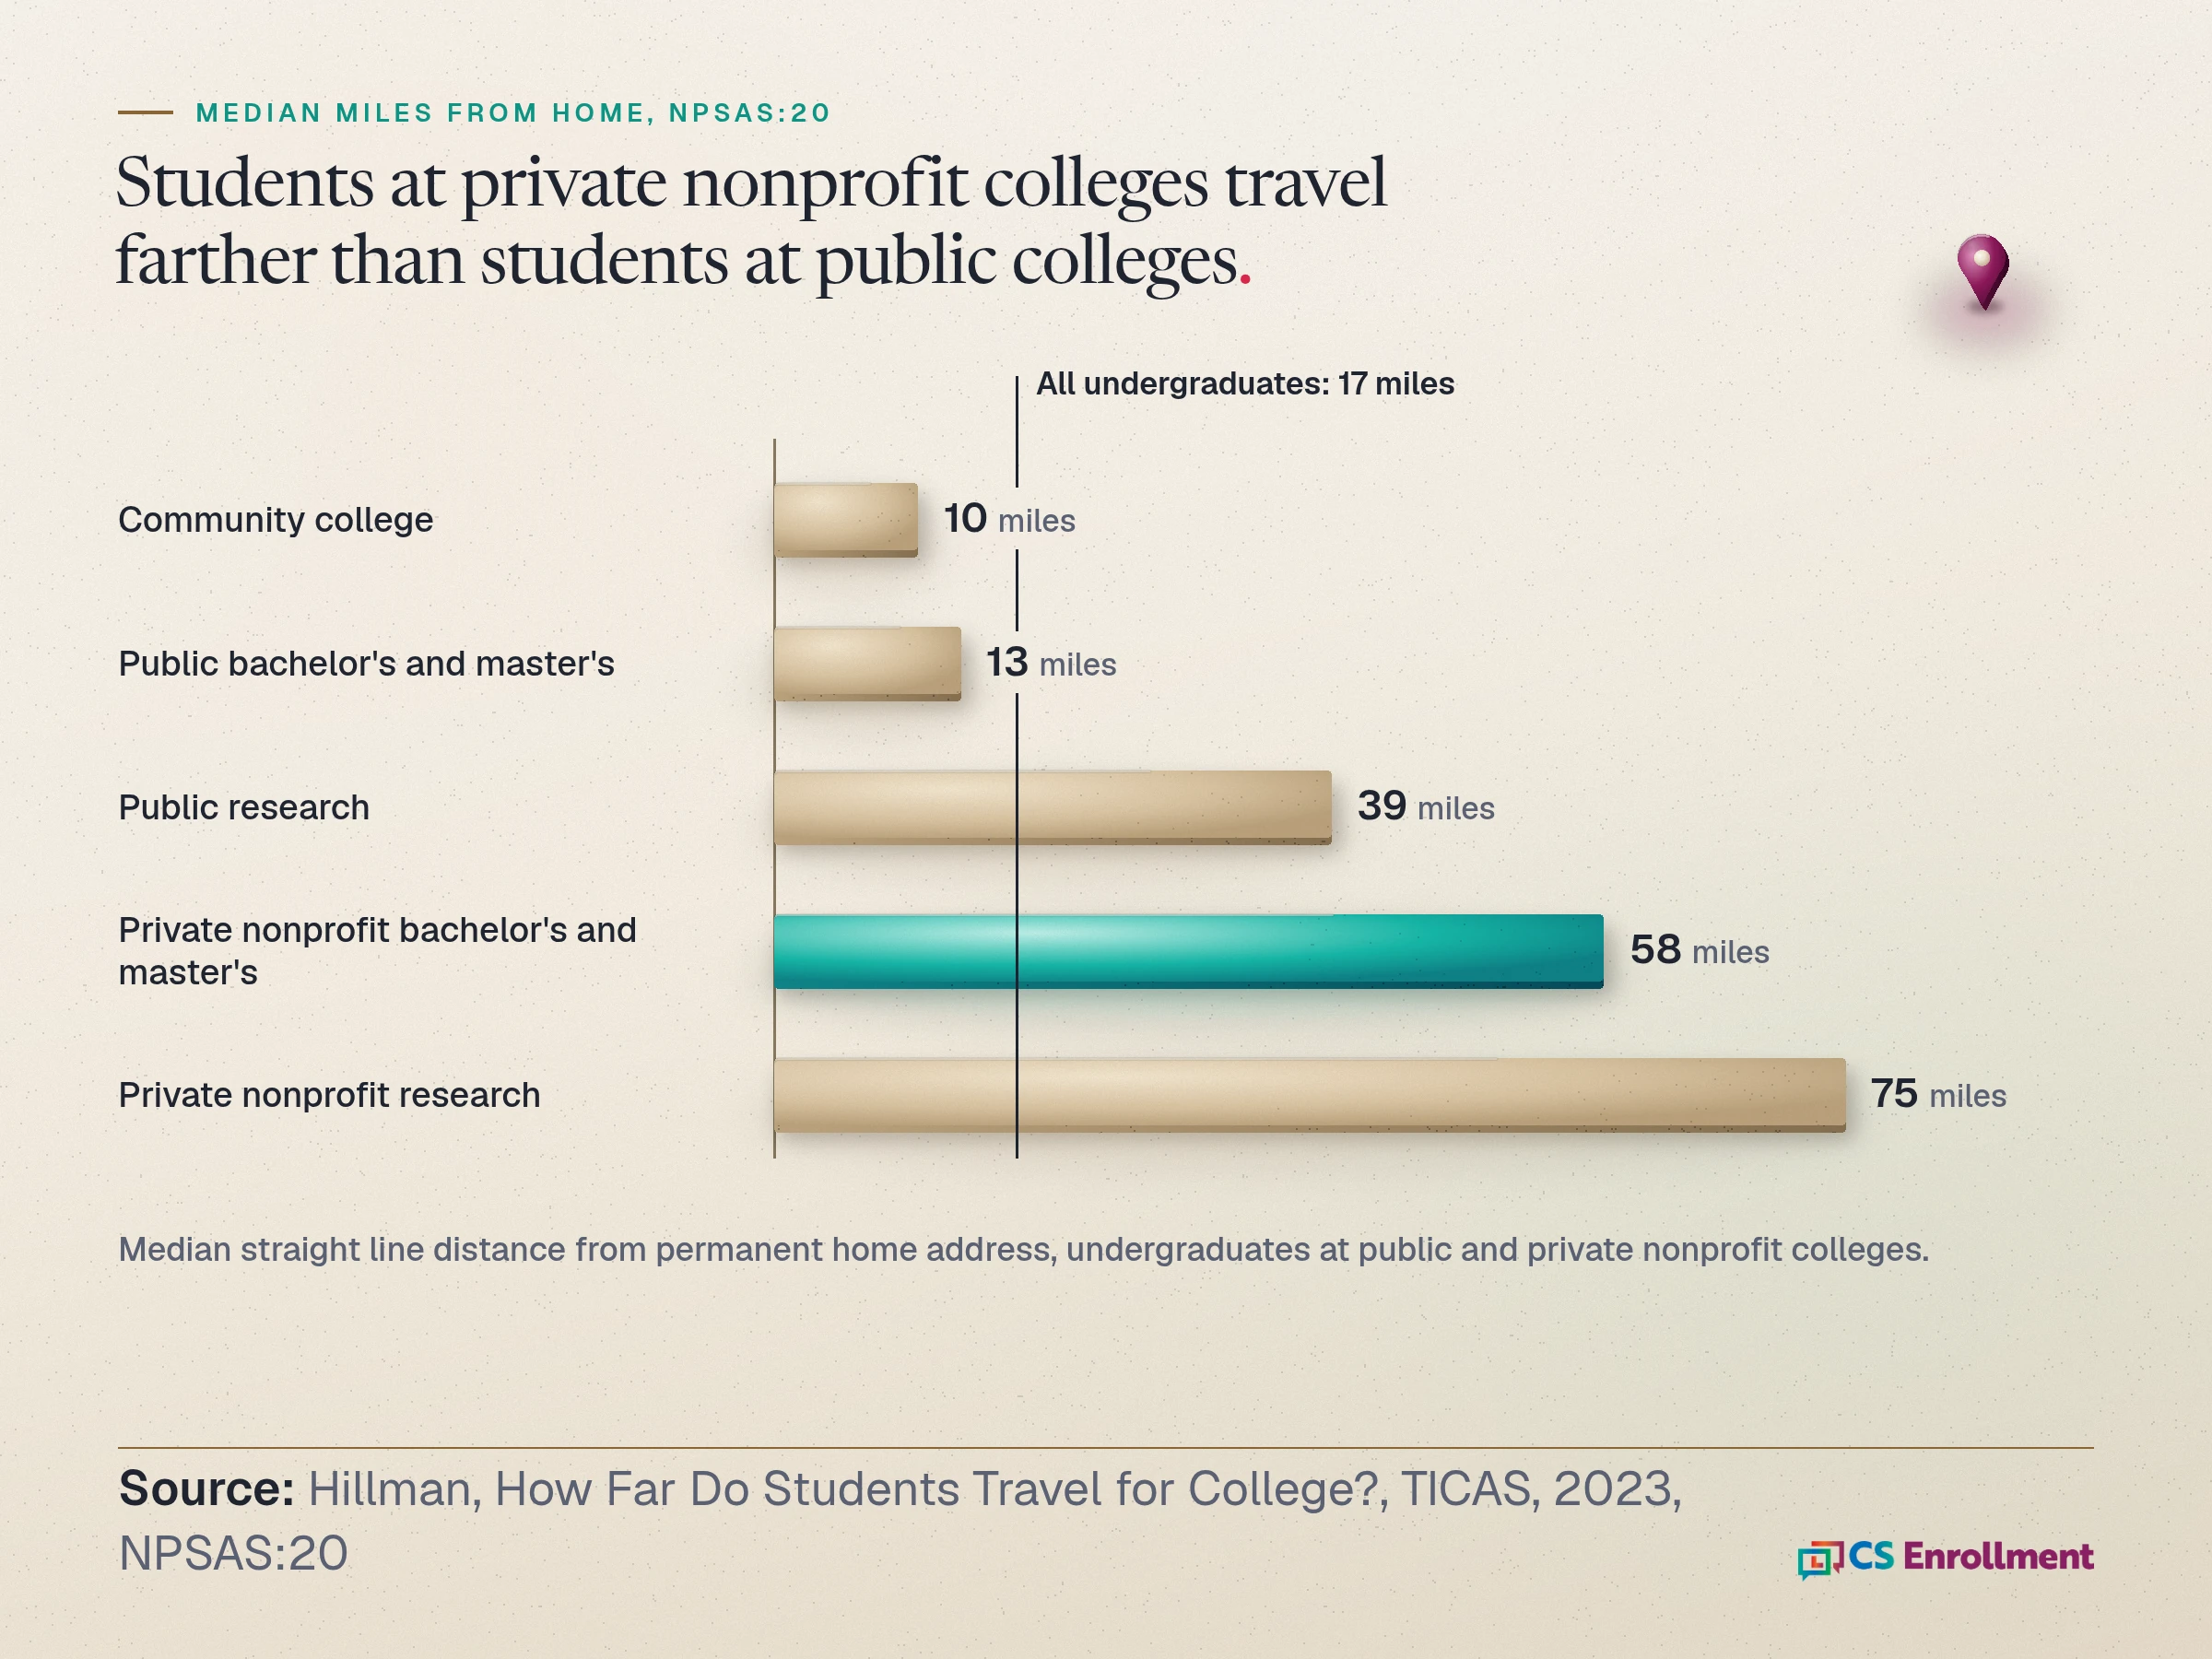
Hillman's Table 1 breaks the median distance out by sector. Community college students had a median of 10 miles. Students at public bachelor's and master's institutions had a median of 13 miles, and students at public research universities 39 miles. At private nonprofit bachelor's and master's colleges, the median was 58 miles. At private nonprofit research universities, it was 75 miles.
At private nonprofit bachelor's and master's colleges, 36% of students attended within 25 miles of home and 47% within 50 miles.
The brief reports medians for a reason. The mean distance for all undergraduates is 141 miles, pulled up by the small share of students who travel very far. The median describes the typical student better. Hillman also reports that the overall median has held relatively steady, rising from 15 miles in 2000 to 17 miles in 2020.
A sector median is not any one college's number. Two private nonprofit colleges in the same category can draw from very different distances. Use these figures as context for your own map, not as a benchmark for it.
Who travels farther, and why many stay close
Hillman writes that students stay close to home "for many good reasons including caring for dependents, work responsibilities, and close ties to their families and/or communities."
Income matters too. In the brief's income analysis, students in the lowest three of five income groups tend to stay closest to home regardless of the type of college they attend. Students in the two highest income groups travel the farthest, especially in the private nonprofit sector.
Hillman describes this as "two very different 'marketplaces' of higher education: one market where colleges compete for highly mobile students and another market where colleges draw heavily from highly localized pools of students."
Our reading: a private nonprofit bachelor's or master's college often recruits in both marketplaces at once. Many of the students nearby are the ones most likely to stay close to home. For them, a clear and early price conversation can matter as much as the program itself. The net price post covers how to make a realistic price easy to find.
Map your own students by distance
Editorial guidance: before you buy names or set a travel budget, find out where your own students actually come from.
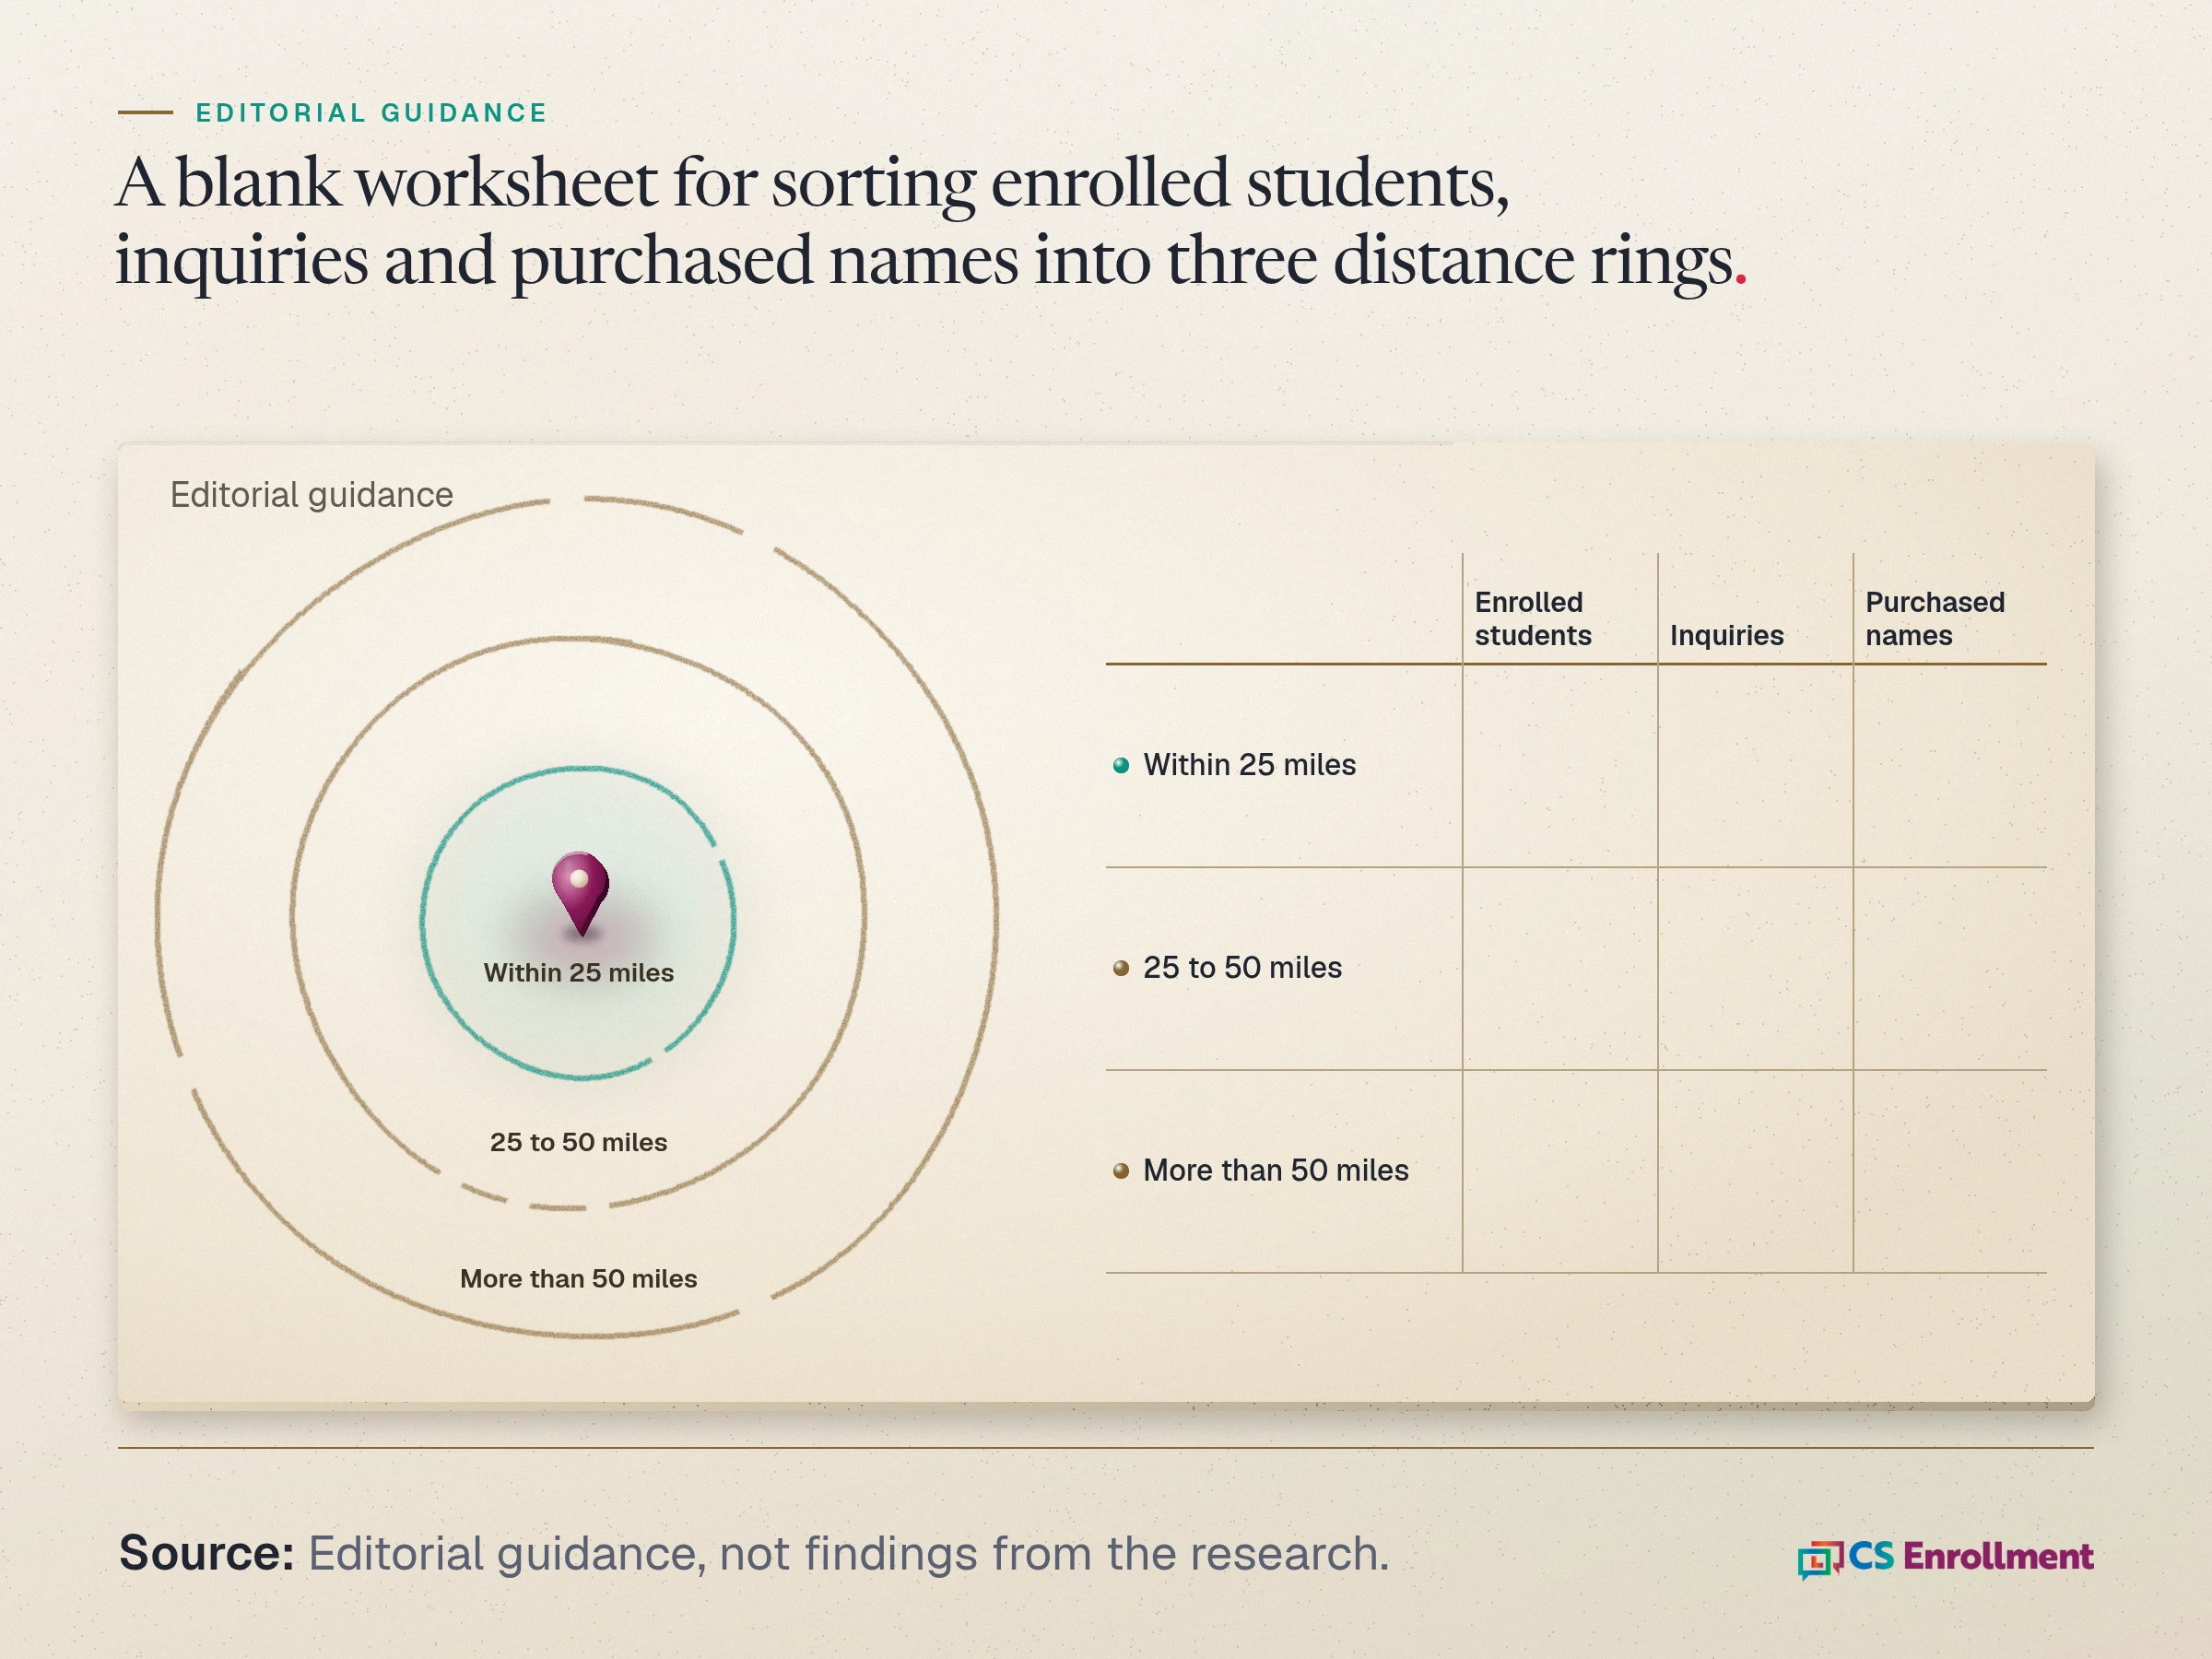
1. Pull home addresses for three lists: last fall's enrolled first year students, this cycle's inquiries, and any names you purchased. 2. Sort each list into three rings: within 25 miles, 25 to 50 miles, and more than 50 miles. 3. Compare the shares across the three lists. If purchased names sit mostly in one ring and enrolled students in another, that gap is worth a conversation. 4. Measure each ring with its own denominator, from inquiry to application to deposit.
The enrollment funnel stages post defines each stage so the counts stay consistent, and the inquiry to application conversion guide explains the calculation. The national sector numbers above are context only. Your own rings are the comparison that matters.
Know the near ring by name
Editorial guidance: the near ring is the part of your market a small college can know in detail. That means every high school, community college, counselor and family within a short drive.
Start with one check: confirm that every student in the near ring who inquired this year heard from the college a second time. Hillman names close family ties as one reason students stay near home, so reach parents as well. The parent engagement guide covers how to reach families directly.
Hillman names dependents and work as reasons students stay close. If your near ring includes working adults, the adult learner recruitment post covers how to reach them. To learn what nearby students want before you decide what to send, a survey led student search asks them.
We make no claim that local outreach raises applications or deposits. Measure the near ring on its own and see what changes.
Recruit the far ring on purpose
Editorial guidance: students who travel far bring different questions. They ask about getting home, housing, the full cost beyond tuition, and why this college instead of one nearby. Answer those questions plainly on the pages and in the messages that reach distant students.
Decide which distant regions are worth the spend, and treat each as its own market. The student search post covers the name buying decision, and the cost per enrolled student guide shows how to compare cost by ring. We make no claim that far students are more or less valuable than near ones. They are a different recruiting job, and they should be measured separately.
Where messaging fits
CS Enrollment Pathways helps a small college follow up with the students in its own region, and the ones farther away, with branded, verified text messaging they can recognize, so a student who asked about you once hears from a real person again.
Of the students within 50 miles of your campus who asked about you this year, how many heard from you a second time?
To see how a branded conversation with a student starts, request the sample walkthrough.
Sources
- Nick Hillman, How Far Do Students Travel for College? Data: U.S. Department of Education, National Postsecondary Student Aid Study 2020 (NPSAS:20). Introduction (17 miles, reasons students stay close, two marketplaces quote); Data Source and Measures (population and distance definition); Table 1 (141 mile mean, 17 mile median, 69% within 50 miles, sector medians, 36% and 47% for private nonprofit bachelor's and master's); Table 2 text (15 miles in 2000 to 17 miles in 2020); Figure 1 text (income pattern).