What do the Common App numbers show so far this season?
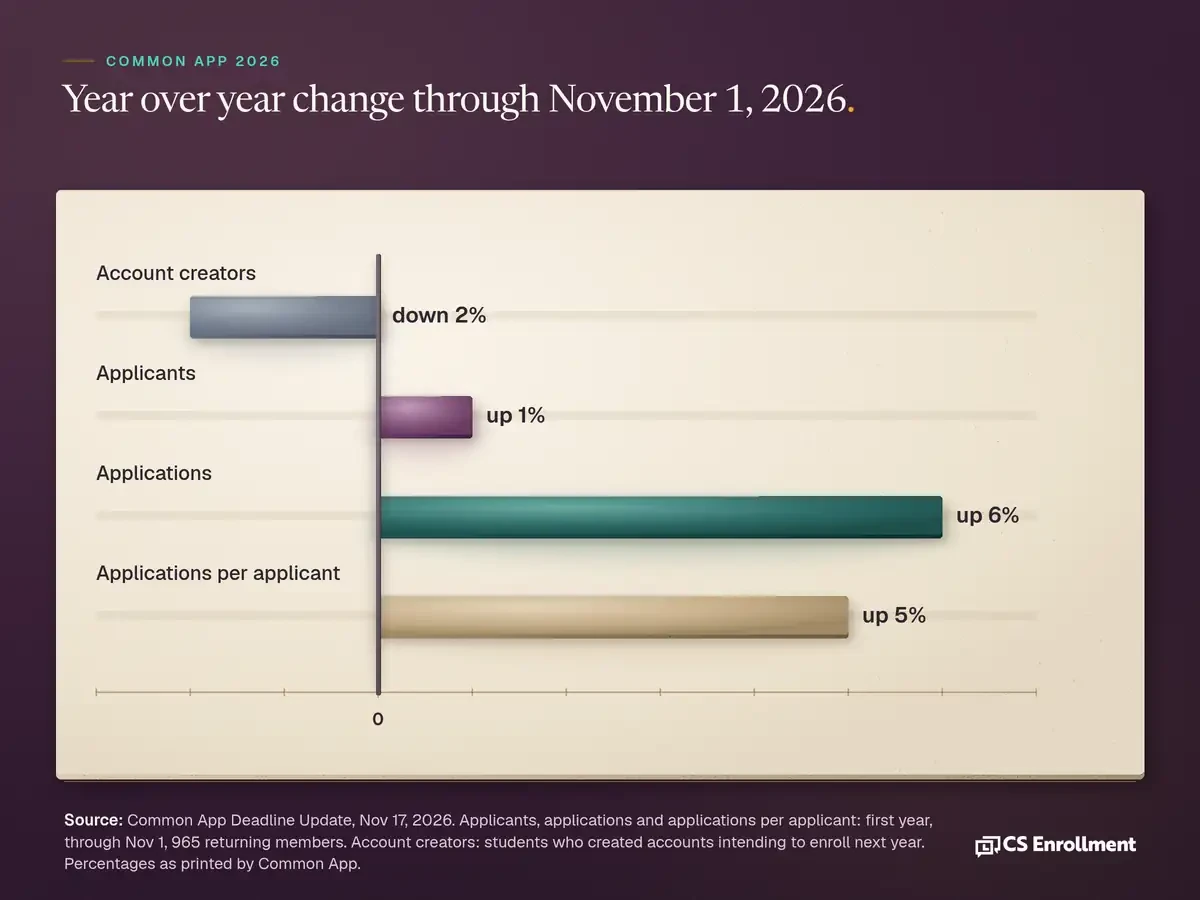
Through November 1, 2026, applications to Common App's returning member colleges are up 6% and applicants are up 1%. Applications per applicant to those members moved from 5.08 to 5.34. Most of the rise in applications is the average applicant sending more of them (our arithmetic from Common App's counts), not many more people applying.
This is Common App data: a nonprofit membership organization reporting on its own platform, not vendor research. It covers first year applications through November 1, 2026, to 965 returning members, meaning institutions that have been Common App members for the five most recent years. The report is dated November 17, 2026. It reflects one platform, early in the season, so it does not describe every college or every applicant.
Here are the counts. Applicants numbered 992,093, up 1% from 981,292 at this point in 2025 to 26. Applications numbered 5,301,045, up 6% from 4,980,983. Applications per applicant to returning members rose 5%, from 5.08 to 5.34.
Students who created Common App accounts intending to enroll next year fell 2%, to 1,980,780, from 2,012,437 at this point last season. Common App notes this is the first decline in account creators on its platform since 2022 to 23, the first season in its charts. Its own footnote says the slowing growth rates among account creators and applicants "in part reflect broader projected declines in the number of high school graduates in the United States beginning in 2025." Our post on the demographic cliff and small colleges covers that longer view.
Why more applications is not the same as more students
Applications grew faster than applicants: 6% against 1%. The difference is applications per applicant, which rose from 5.08 to 5.34. An applicant who applies to more colleges adds more applications but still counts as one applicant. The report gives no reason for the rise in applications or for the rise in applications per applicant, and this post does not guess at one.
Our reading: when applicants send more applications, each one says a little less about how much a student wants your college. A higher application count can sit beside a lower share of applicants who enroll. Common App does not say this. It is our interpretation, and your own data is the way to test it.
Did your own applications rise? What the member breakdown shows
Common App also reports what share of returning members saw each kind of change. Overall, 63% of returning members saw an increase or stable application volume compared with this time last season, while 37% saw a decrease. These are shares of institutions, not of applications or students.
Our reading: in a season when applications rose 6% and applicants rose 1%, 37% of returning members still saw a decline. The platform total says little about any one college, including yours. Your own count compared with your own count a year ago is the only version that applies to your class.
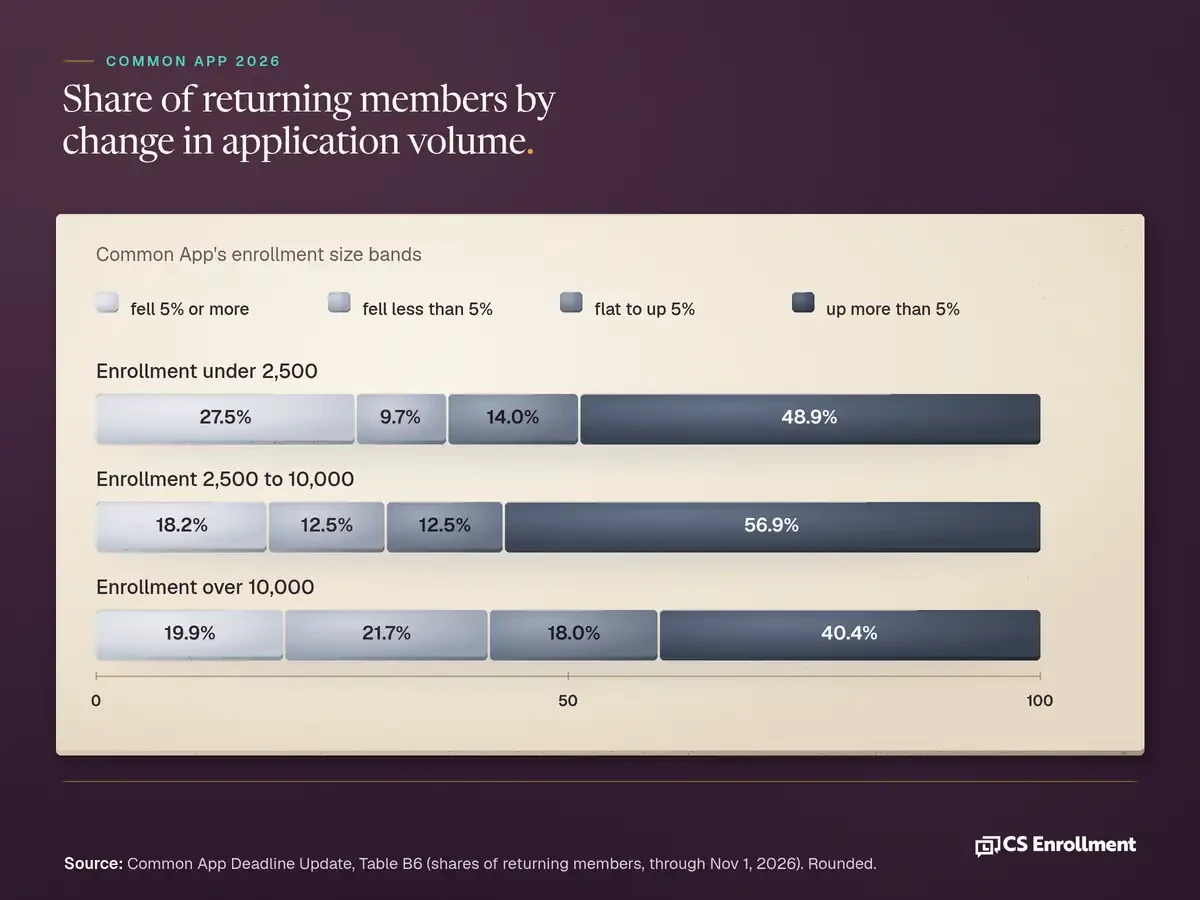
Common App's Table B6 splits returning members by the change in their application volume. Overall, 24.1% fell 5% or more, 12.5% fell less than 5%, 13.8% were flat to up 5%, and 49.6% rose more than 5%. Common App's own enrollment size bands, which are not ours, give these shares in the same four groups. Enrollment under 2,500: 27.5%, 9.7%, 14.0% and 48.9%. Enrollment from 2,500 to 10,000: 18.2%, 12.5%, 12.5% and 56.9%. Enrollment over 10,000: 19.9%, 21.7%, 18.0% and 40.4%. Rows sum to 100.0% or 100.1% because of rounding.
Our reading: every size band has members on both sides of the change. The table is not a ranking of bands, and the average for a band predicts little about one college in it.
How much weight should a November 1 snapshot carry?
Common App's own notes give the limits in plain language.
- The data covers returning members only: 965 institutions. Common App says trends "may still partially result from new members bringing new applicants onto the platform each year."
- Some institutions that had a November 1 deadline moved it to later in the month this cycle. Common App says changes like these "could account for variation in application volume compared to prior years."
- The data stops at November 1 and covers first year applications on one platform.
Our reading: an early read is a reason to look at your own data, not to change a plan. Common App says it times its deadline update briefs to the first of each month from November to March, so the picture can keep filling in.
If you are a Common App member, the Analytics section of the member Control Center has filterable data charts. Members on Common App's custom platform can also build benchmark groups of 10 to 20 members to compare themselves with chosen peers. That describes the tools. It is not a recommendation of Common App.
What to track instead of the application count
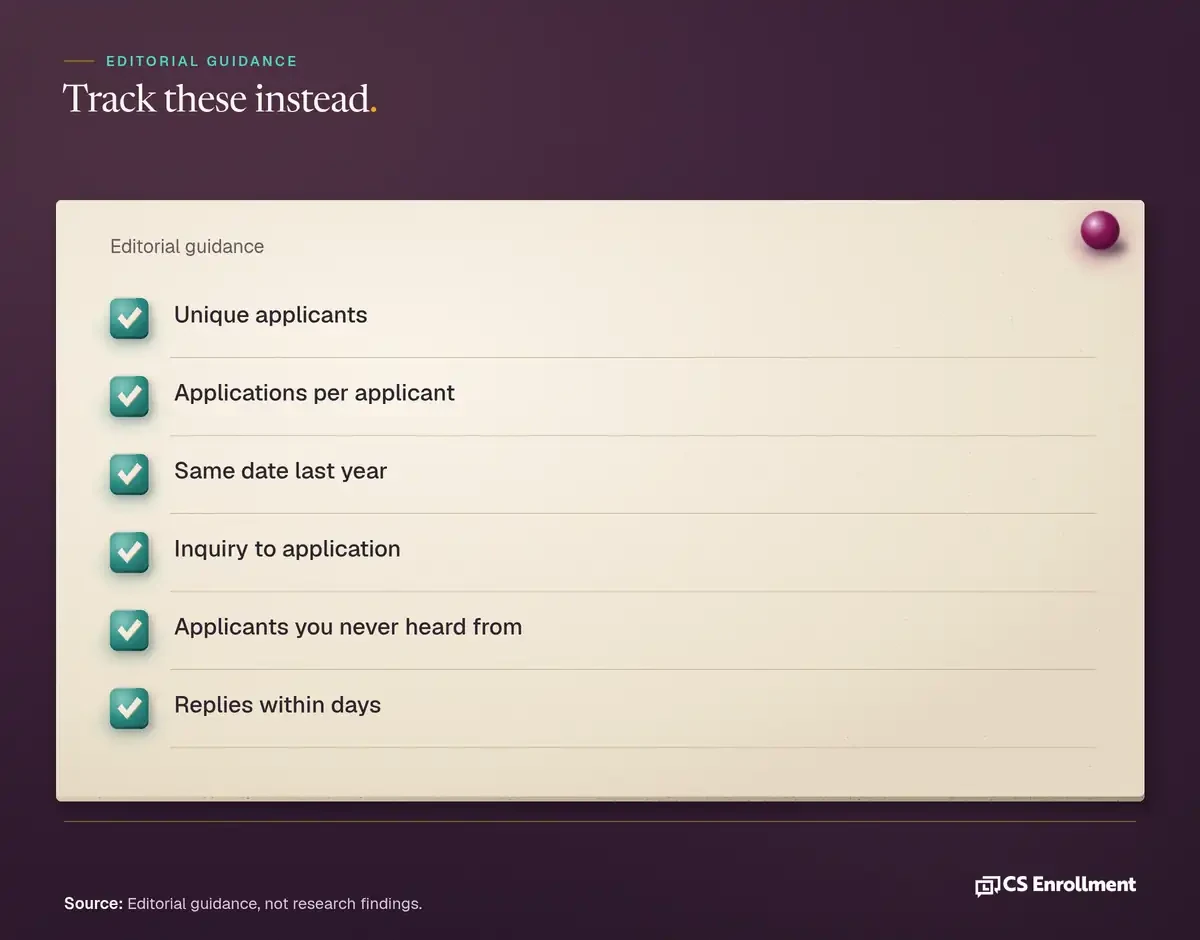
Editorial guidance:
1. Count people, not only applications. Track unique applicants and applications per applicant in your own system. Our post on enrollment funnel stages explains how to count people at each stage. 2. Compare to the same date last year at each step. Look at inquiry to application, application to complete file, and admit to deposit. Our inquiry to application conversion rate post shows the first step. 3. Watch for applicants you never heard from. A rising count with a flat inquiry pool means more people you have not met. See stealth applicants. 4. Reply to every new applicant with a person and one question within days. For example: "What would help you decide?" Our post on survey led student search covers asking one question well. 5. Plan the admit stage for applicants who sent more applications. The plan from admit to deposit is in how to increase college yield.
Common questions
Are college applications up this year? Through November 1, 2026, Common App applications to its 965 returning members were up 6% and applicants were up 1%. That is Common App data from one platform, early in the season, not vendor research.
What is applications per applicant in this report? Through November 1, 2026, applications per applicant to returning members rose from 5.08 to 5.34. It counts applications to those members through that date only, so it is not a season total, and it is not a count of every college a student applies to.
Does a rise in applications mean a bigger class? Not by itself. Applications rose faster than applicants, so a higher count does not show more students. Our view: yield and enrollment depend on what happens after the application.
Where messaging fits
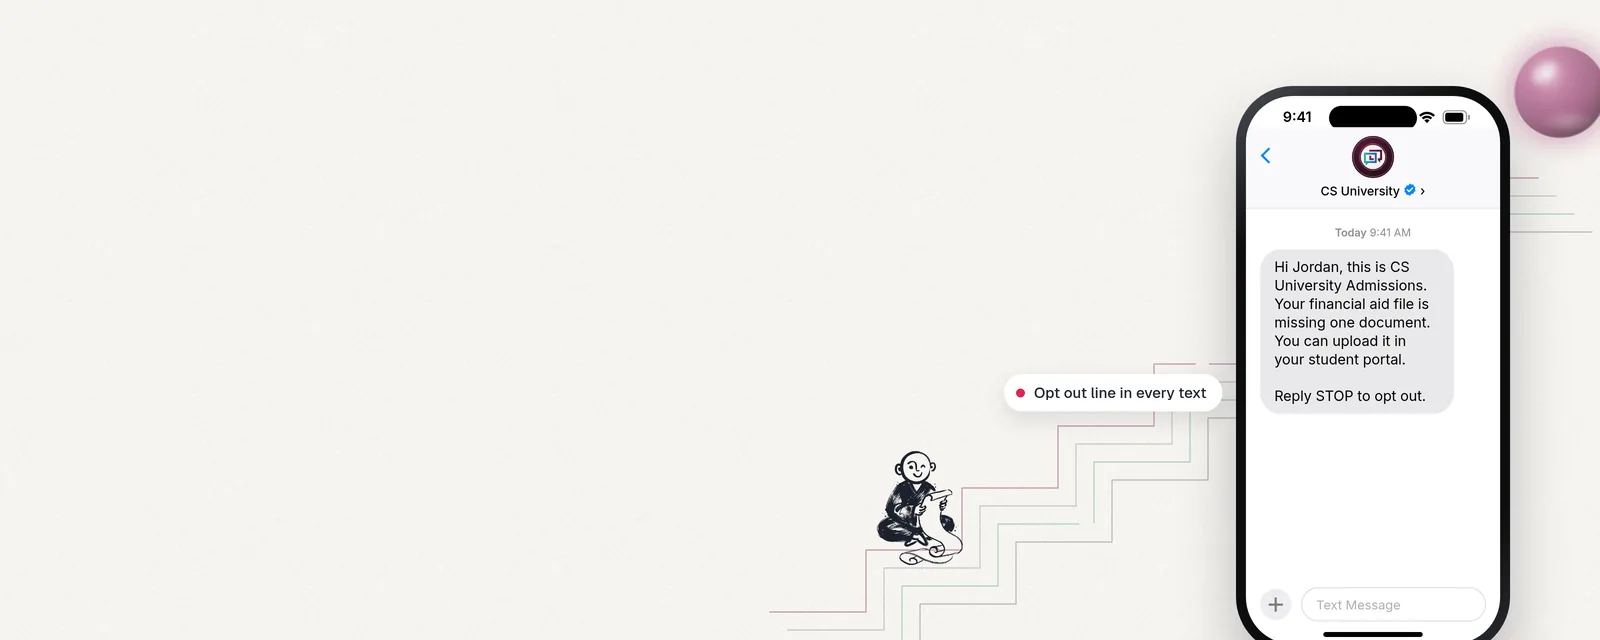
CS Enrollment Pathways lets your team check in with every new applicant in branded, verified text messaging from a sender they recognize, so every applicant hears from a real person at your college while there is still time to talk. A one question check in, "What would help you decide?", is how we start.
How many of your applicants this fall have heard from a person at your college since they applied?
To see how a branded conversation with a new applicant starts, request the sample walkthrough.
Sources
- Common App Data Analytics and Research, Common App November 2026 Deadline Update. Common App data, not vendor research: first year applications through November 1, 2026, to 965 returning members. Introduction notes, page 1; key findings, page 3; overview and footnote 2, page 4; trends by member characteristics and footnote 11, page 23; Table B6, page 45.